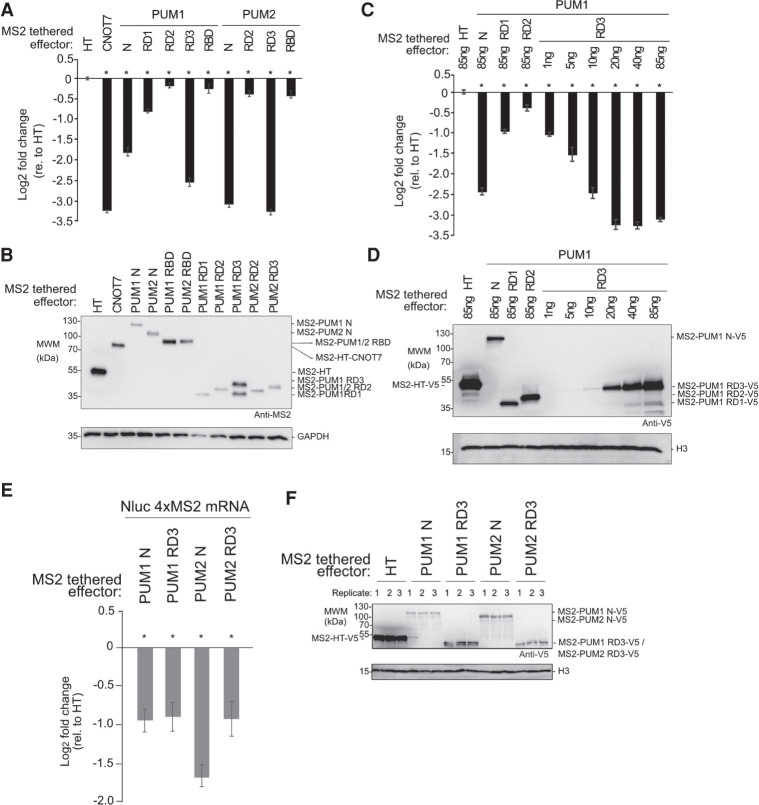
FIGURE 5.
Functional dissection of the amino-terminal repressive regions of human PUM1&2. Mean log2 fold change values ±SEM are plotted and listed in Supplemental Table S1. (*) P-value <0.05 relative to the negative control MS2-HT (above x-axis). (A) Activity of putative repression domains (RD1, RD2, and RD3) and RBDs of PUM1&2, fused to MS2 coat protein and HT, measured in tethered function assays. MS2 fusions of HT and CNOT7 served as negative control and positive control, respectively. n = 9. (B) Western blot of MS2-tagged proteins from a representative experimental replicate from samples in A. GAPDH served as loading control. (C) Activity of MS2-PUM1 RD3 compared to PUM1 N, PUM1 RD1 and PUM1 RD2 MS2 fusions relative to MS2-HT. Transfected plasmid mass is indicated and is balanced across conditions with an empty vector. n = 9. (D) Western blot of V5-epitope tagged proteins from a representative experimental replicate from samples in C. Histone H3 service as a loading control. (E) Effect of PUM1 N, PUM1 RD3, PUM2 N and PUM2 RD3 MS2 fusion effectors on Nluc 4xMS2 mRNA levels, relative to MS2-HT, measured by RT-qPCR. n = 9. (F) Western blot of V5-tagged proteins from a representative experimental replicate from samples in panel E.

