
FIGURE 1.
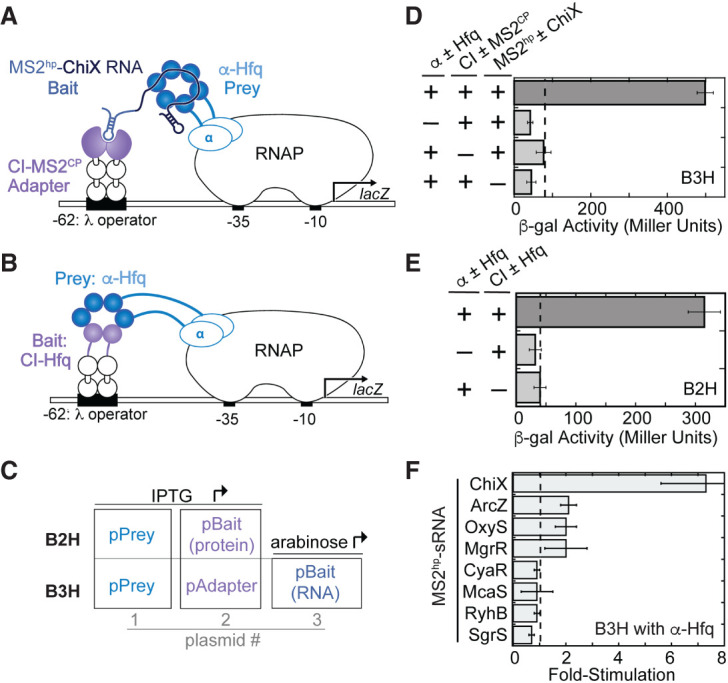
Bacterial two- and three-hybrid interactions with Hfq. (A) Schematic showing B3H system for detection of Hfq–RNA interactions. Interaction between an Hfq “prey” protein moiety and RNA “bait” moiety activates transcription from a test promoter, which directs transcription of a lacZ reporter gene. The test promoter (plac-OL2–62) bears the λ operator OL2 centered at position −62 relative to the transcription start site. The RNA-binding moiety MS2CP is fused to λCI (CI-MS2CP) as an RNA–DNA adapter (“Adapter”) to tether the hybrid RNA (MS2hp-ChiX) to the test promoter. (B) Schematic showing B2H system. Interaction between Hfq protein moieties fused, respectively, to α-NTD (α-Hfq) as “Prey” and to λCI protein (CI) as “Bait” activates transcription of lacZ from the same OL2–62 test promoter as above. (C) Schematic showing the plasmids used to express bait and prey hybrid components in two-hybrid (B2H) and three-hybrid (B3H) assays and, in the case of the B3H assay, the adapter protein. Inducers that drive expression of each component are indicated. (D) Results of β-galactosidase (β-gal) assays performed in KB473 cells transformed with three compatible plasmids: pPrey (α ± Hfq) that encoded α alone (−) or the α-Hfq (+) fusion protein, pAdapter (CI ± MS2CP) that encoded λCI alone (−) or the CI-MS2CP fusion protein (+), and a pBait (MS2hp ± ChiX) that encoded a hybrid RNA with the ChiX sequence following two copies of an MS2hp moiety (+) or an RNA that contained only the MS2hp moieties (−). (E) Results of β-gal assays performed in KB473 containing three compatible plasmids: one (α ± Hfq that encoded α alone [−] or the α-Hfq [+] fusion protein and another [CI ± Hfq] that encoded λCI alone [−] or the CI-Hfq fusion protein [+]). (F) Results of B3H β-gal assays performed in KB473 cells with pAdapter (CI-MS2CP, pKB989), pPrey (α-Hfq, pKB817), and pBaitRNA (2xMS2hp moieties fused to the listed sRNAs). The corresponding negative controls as in C were also conducted in parallel. The bar graph here, and for all subsequent B2H and B3H experiments, shows the fold-stimulation over basal levels: that is, the β-gal activity measured in the presence of all hybrid constructs divided by the activity of the highest negative control sample expressing only half of one hybrid construct. The dashed horizontal line represents “basal” levels. Data are presented as the average value of three independent measurements and error bars show the standard deviation of these values.