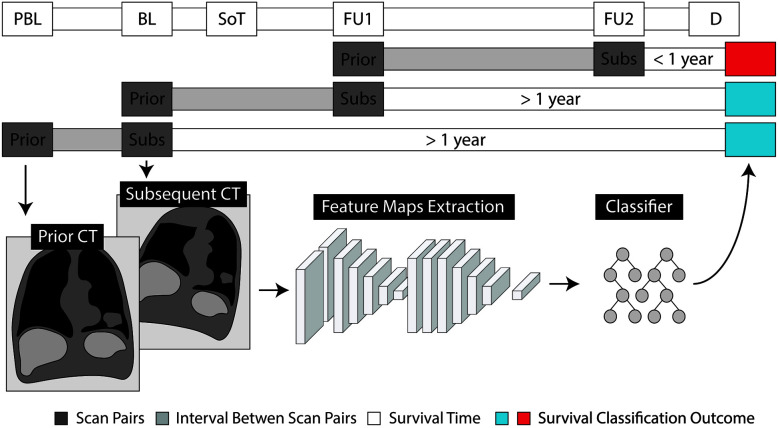
Figure 2.
Schematic representation of the evaluation of prognostic values through quantitative monitoring. Radiological examinations are shown as pre-baseline (PBL), baseline (BL) and follow-up (FU), with respect to the start of treatment (SoT). Prediction of survival is made based on the time of death (D). For each pair of subsequent scans, we label the earlier one as prior and the subsequent as subsequent (Subs).

