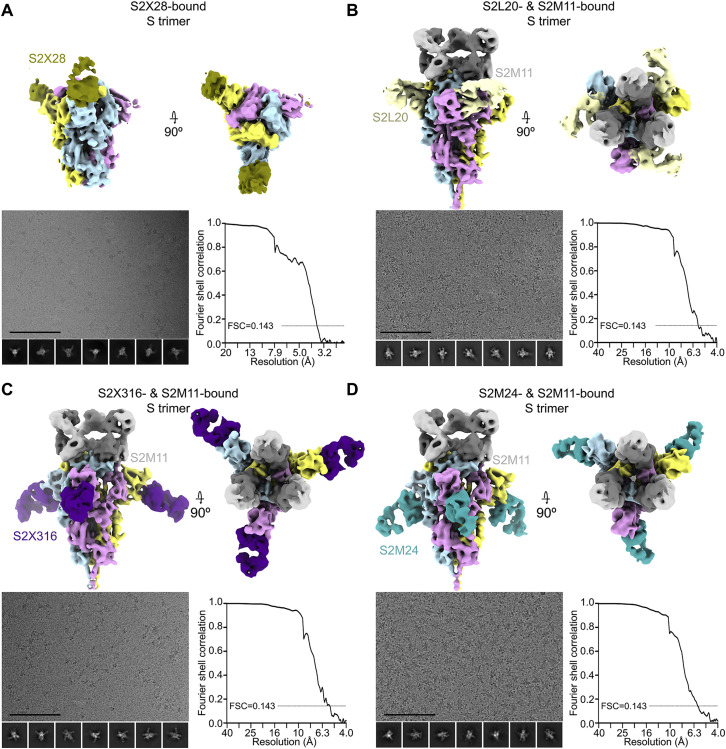
Figure S3.
Cryo-EM data processing of SARS-CoV-2 S bound to S2X28, S2L20, S2X316, or S2M24, related to Figures 2 and 3
(A) 6 Å low-pass filtered map of the SARS-CoV-2 2P DS S trimer (McCallum et al., 2020) bound to S2X28 (gold).
(B–D) Sharpened maps of the S trimer bound to S2M11 Fabs and S2L20 (B, gray), S2X316 (C, purple), or S2M24 Fabs (D, sky blue). Representative electron micrographs and class averages are shown at the bottom left of each panel (Scale bar: 100 nm). The corresponding Fourier shell correlation curves (bottom right of each panel) are shown with the 0.143 cutoff indicated by horizontal dashed lines.

