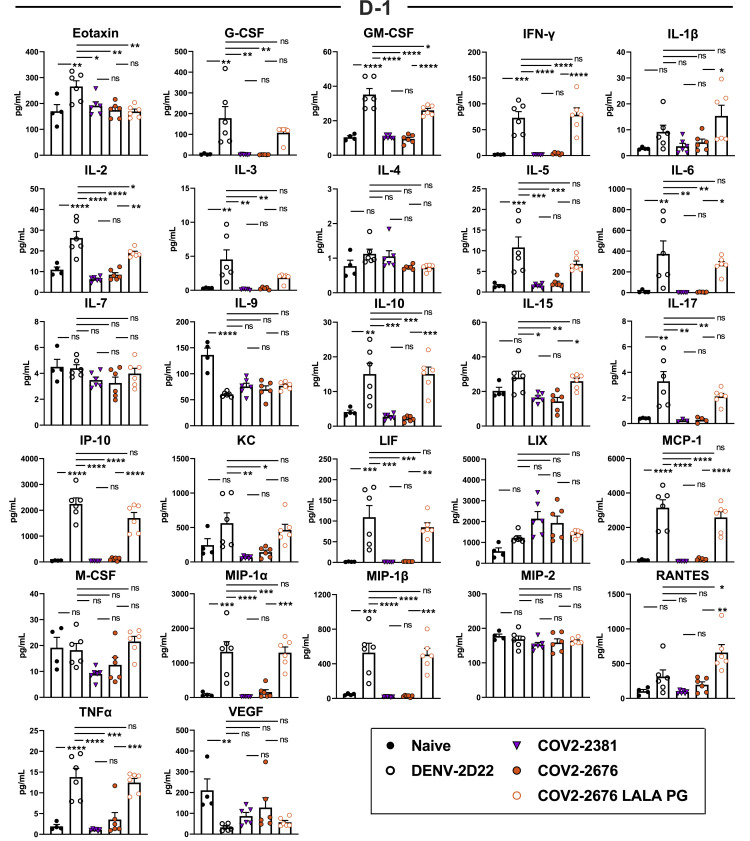
Figure S5.
Cytokine and chemokine levels in the lungs of SARS-CoV-2-infected mice, related to Figure 4
Cytokine and chemokine levels in the lungs of SARS-CoV-2 infected mice at 7 dpi following d-1 treatment with isotype, COV2-2381, COV2-2676, and COV2-2676 LALA PG as measured by a multiplex platform (two independent experiments, n = 6 per group. One-way ANOVA with Tukey’s post hoc test: ns, not significant, ∗p < 0.05, ∗∗p < 0.01, ∗∗∗p < 0.001, ∗∗∗∗p < 0.0001.)

