
Figure 1. Mobilization of plasmalogen-derived PUFAs correlates with the disease severity in COVID-19.
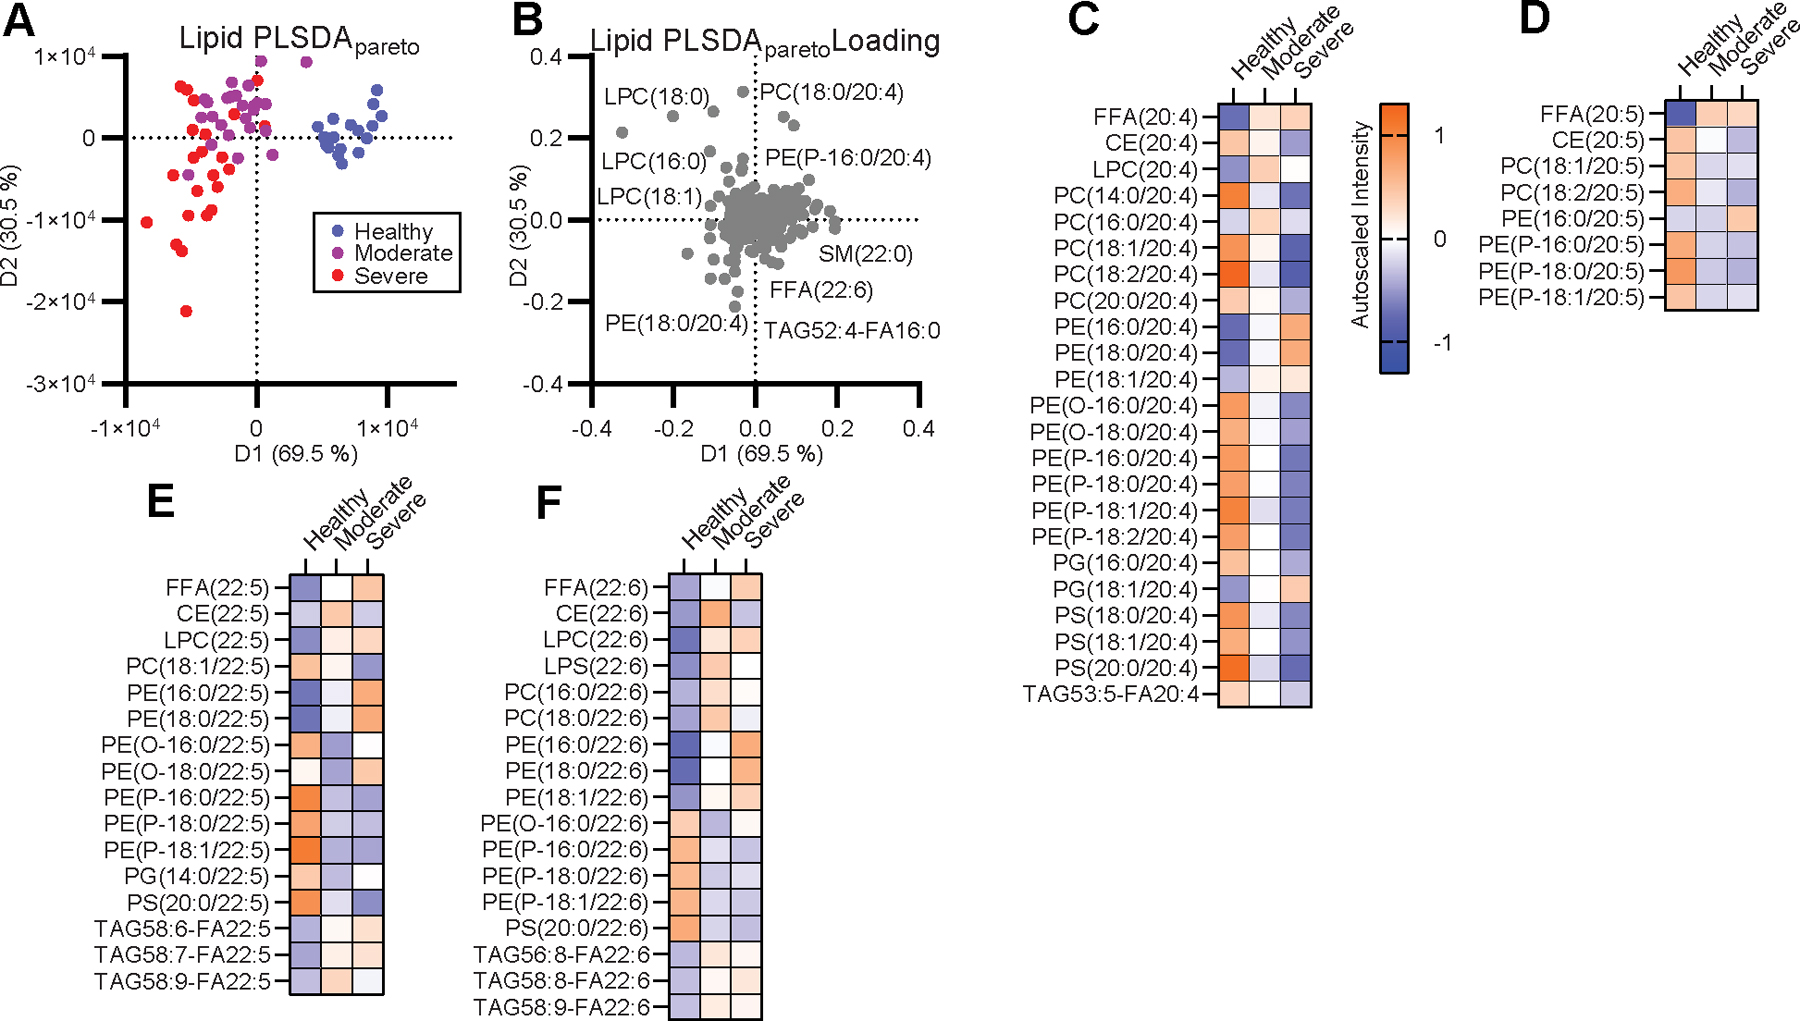
(A) Supervised PLSDA analysis of the healthy, moderate and severe disease groups and (B) the corresponding feature loading plot. (C-F) Heatmap of the autoscaled mean intensity of each patient group for significantly varied lipids containing C20:4 (C), C20:5 (D), C22:5 (E), and C22:6 (F) between one or more groups adjusted for a false discovery rate (FDR) of 10 % due to multiple comparisons. Color scale is consistent for (C-F).