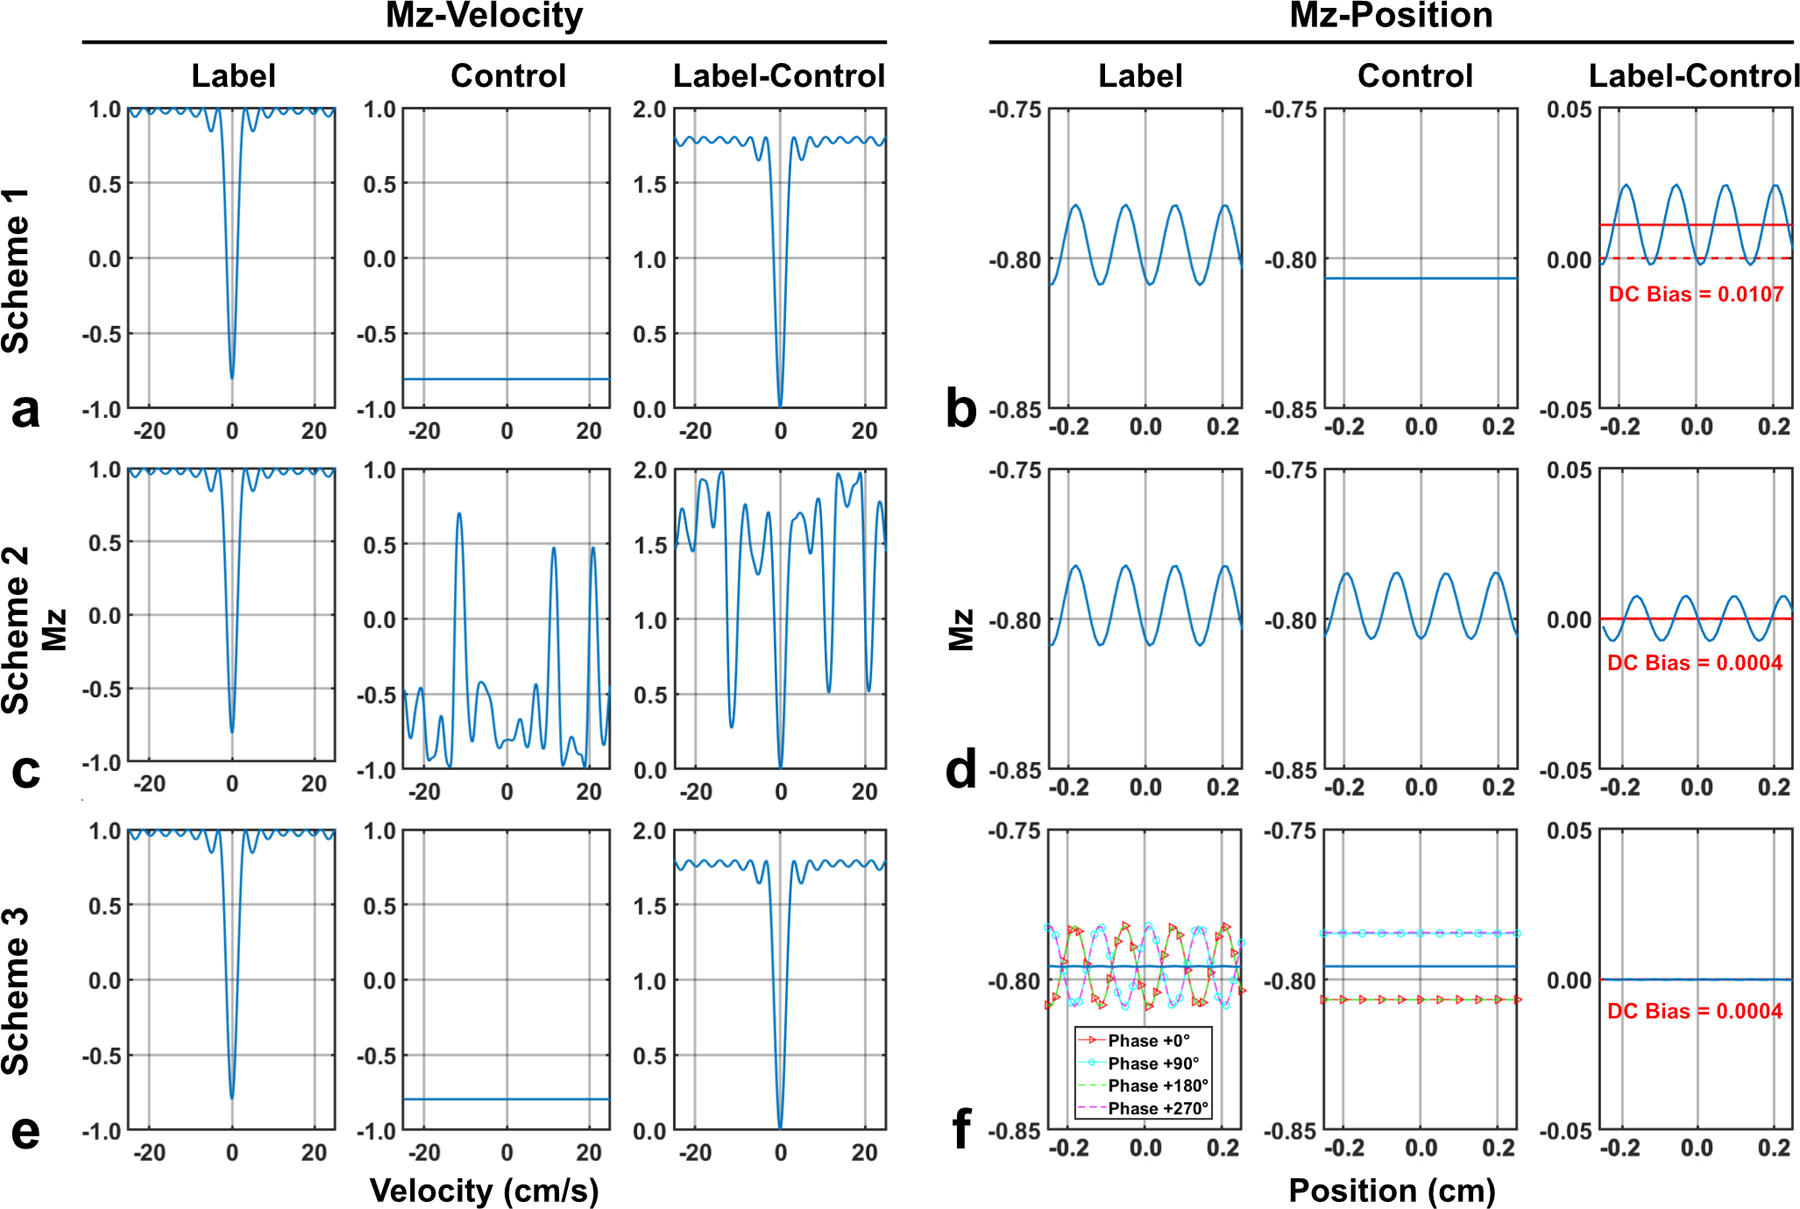
Figure 1:

Simulated Mz-velocity profiles (position = 0 cm) and Mz-position profiles (velocity = 0 cm/s) of FT-VSI label and control pulse trains at the B1+ scale of 0.8 and their subtractions with (a,b) scheme 1 using velocity-insensitive control; (c,d) scheme 2 using velocity-compensated control; and (e,f) scheme 3 using dynamic phase-cycling. For both label and control in scheme 3 (f), Mz-position profiles from all four phases were shown by four colored dashed lines. In Mz-position profiles (b,d,f), solid red lines indicate the DC bias averaged from signals at all positions. In contrast to spatial response of scheme 1 (b) and velocity response of scheme 2 (c), scheme 3 showed well-preserved velocity-selective profile (e) as well as minimal spatial stripe artifact and DC bias (f).
