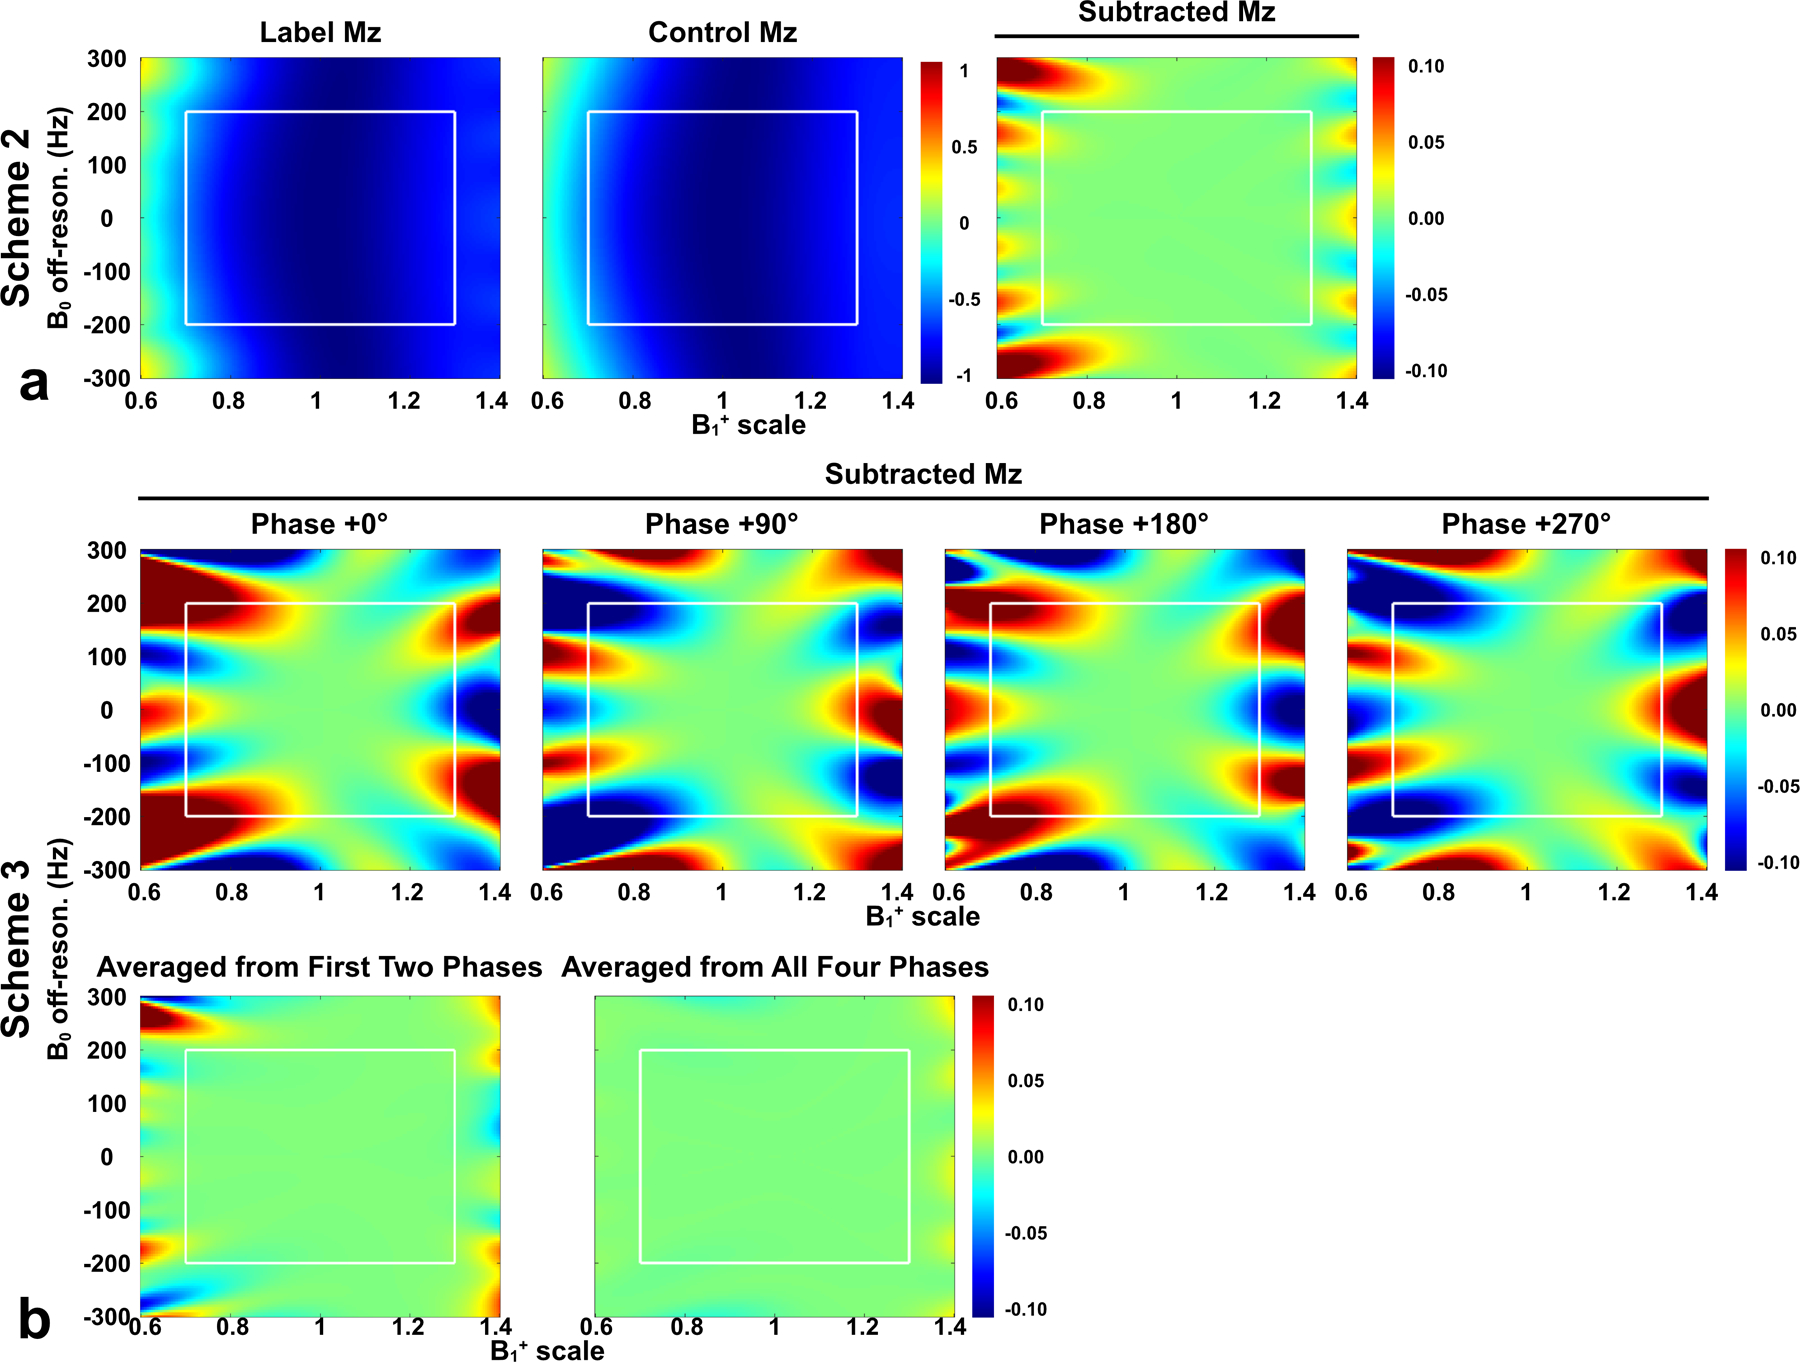
Figure 3:

DC bias of Mz-position profiles following simulation of FT-VSI pulse trains with a range of B0 (±300 Hz) and B1+ (±0.4). Label, control, and subtracted Mz were shown for (a) scheme 2 using velocity-compensated control, while only subtracted Mz was shown for (b) scheme 3 using dynamic phase-cycling. In scheme 3, four individual dynamic phases (second row) and averages of first two phases and all four phases (third row) were shown. Note that scheme 3 with the phase of 0° was just scheme 1. White rectangles indicated the typical B0/B1+ range of human brain at 3T (B0: ±200 Hz; B1+ scale: ±0.3). Compared to the other two schemes, scheme 3 considerably mitigated the DC bias as false perfusion signal.
