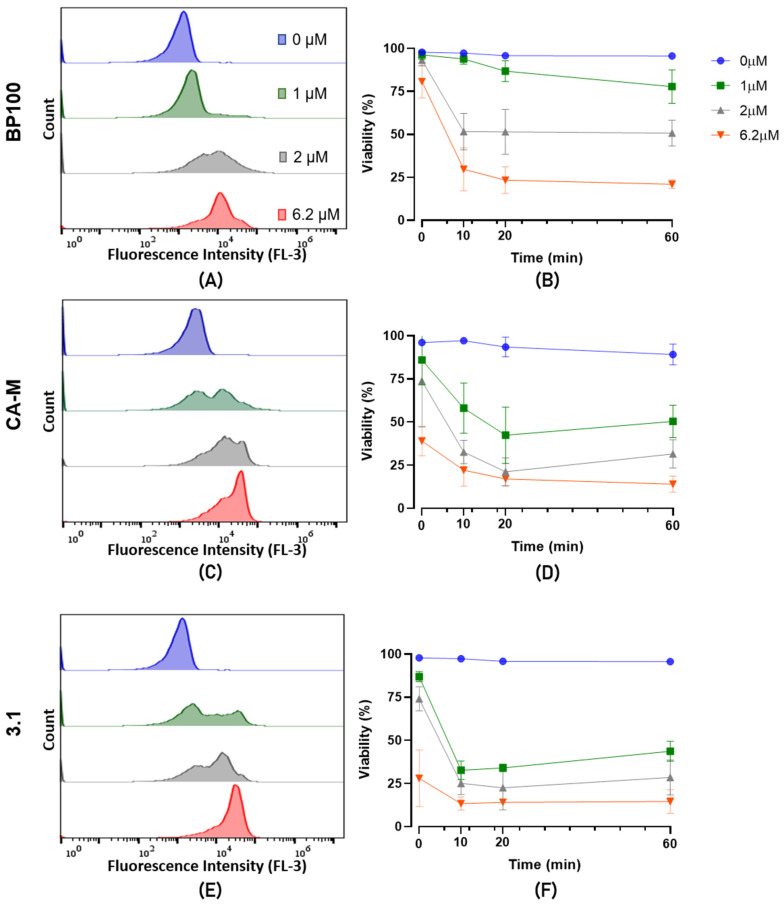
Figure 3.
Flow cytometry analysis of PI-stained CFBP7286 Psa treated with (A,B) BP100, (C,D) CA-M, and (E,F) 3.1. Treatments consisted of 1 h with the corresponding peptide at (blue, ●) 0 µM, (green, ■) 1 µM, (grey, ▲) 2 µM, and (red, ▼) 6.2 µM. (A), (C), and (E) represent the fluorescence peak on FL3 detector showing the self-fluorescence at 0 µM to PI-detected cells shifting to the right with AMPs treatments. The assay was repeated three times.

