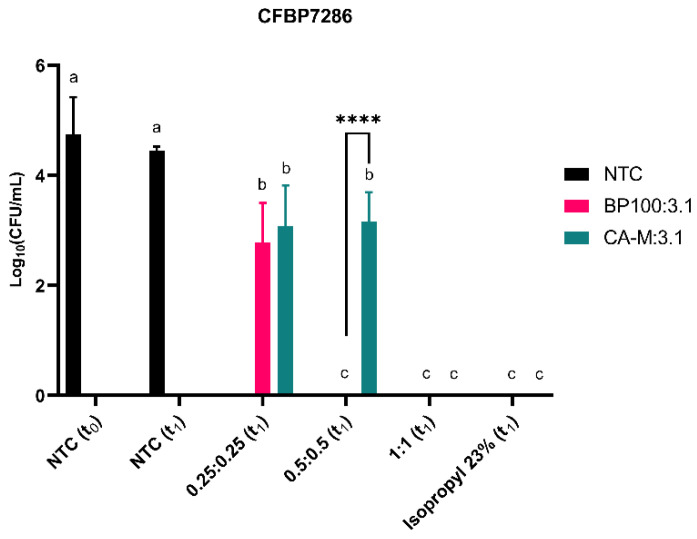
Figure 6.
Evaluation of cell viability of CFBP7286 Psa at CFUs after 1 h of treatment (t1) with two AMPs mixtures: BP100:3.1 and CA-M:3.1. The combinations used were at 0.25:0:25, 0.5:0.5 and 1:1 µM for both mixtures. Non-treated cells (NTC) were used at t0 and t1. Isopropyl alcohol at 23% is a positive control. Statistical letters represent the differences between AMPs concentrations and NTC for each mixture. **** means a statistical significance with p < 0.0001. The assay was repeated three times and analyzed with a one-way ANOVA (GraphPadTM). Letters in the top of the bars means significant differences.

