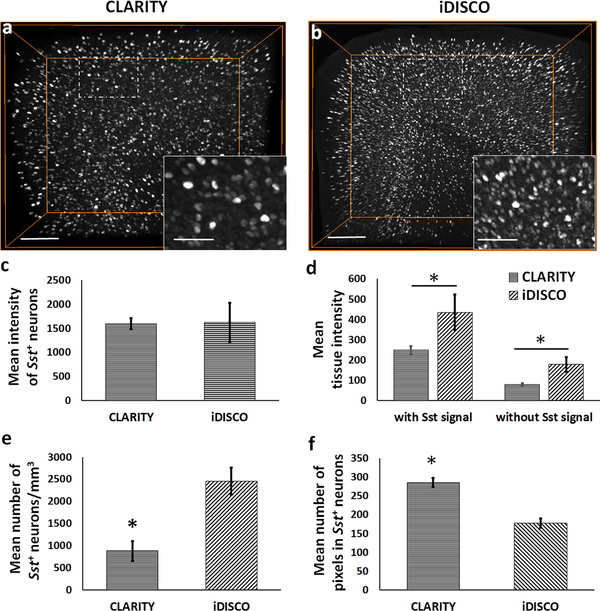
Fig. 1. Quantitative differences in the HCR FISH signal (Sst transcript expression) between CLARITY and iDISCO+.
(a-b) 3D volume-rendered images of representative CLARITY and iDISCO+ samples, respectively, showing the observed differences in the detected neuronal density and mean tissue intensity. (c) Bar-diagram shows comparable mean intensity of the detected Sst+ neurons in the acquired cortical ROI between CLARITY and iDISCO+. (d) Mean background tissue intensity, with or without including the Sst signal, and (e) mean number of Sst+ neurons per unit volume were significantly lower in CLARITY samples as compared to the iDISCO+ samples, for consistent cortical ROIs. (f) Bar-diagram shows a significantly higher mean number of pixels in the detected Sst+ neurons in CLARITY images vs. iDISCO+. *p< 0.05. Scale bars- 200 μm (Insets-75 μm).

