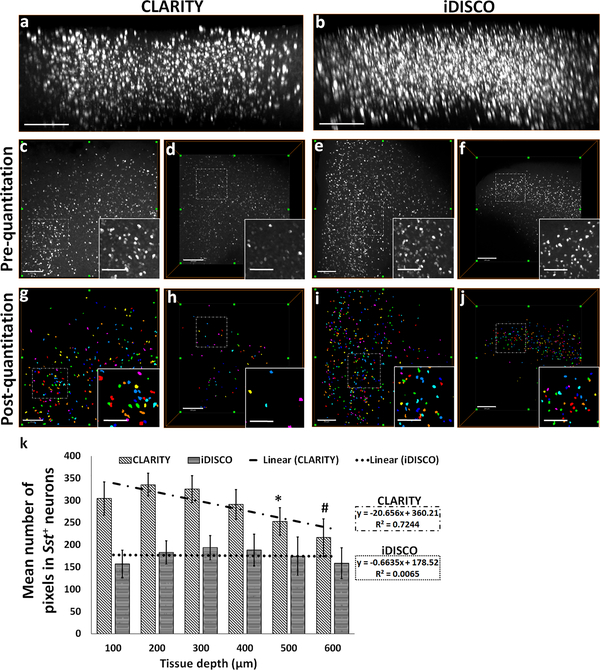
Fig. 2. Attenuation of the HCR FISH signal in CLARITY samples measured as a function of z-depth.
xz-plane view of 3D rendered confocal microscope-acquired volumes of (a) CLARITY and (b) iDISCO+ showing greater attenuation of HCR FISH signal with depth. Representative xy-plane images at 100 μm z-depth: CLARITY- (c) pre-quantitation, (g) post-quantitation, iDISCO+- (e) pre-quantitation, (i) post-quantitation, respectively. Representative xy-plane images at 500 μm z-depth: CLARITY- (d) pre-quantitation, (h) post-quantitation, iDISCO+- (f) pre-quantitation, (j) post-quantitation, respectively. (k) Bar-diagram shows mean number of pixels in the detected neurons as a function of increasing z-depth (100 to 600 μm) in CLARITY and iDISCO+ samples. Following the thresholding and quantitation, each neuron is identified and assigned a unique index and displayed using a cyclic colormap so that cells in close proximity are more likely to be shown in a different color. For CLARITY samples, *p<0.05 for comparisons between 100/200/300 vs. 500 μm and #p<0.05 for 100/200/300/400 vs. 600 μm. Scale bar- (a-b) 300 μm; (c-j) 250 μm (Inset bars-100 μm).

