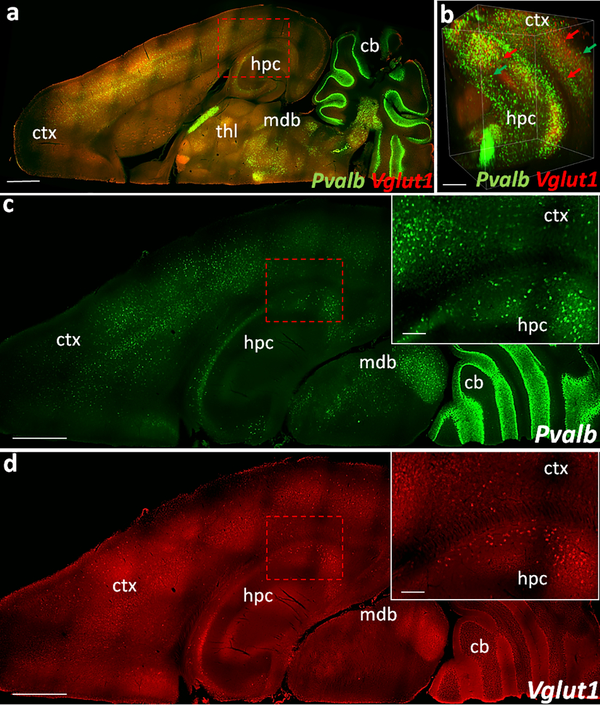
Fig. 5. 3D visualization of COLM acquired dual HCR labeling in iDISCO+ tissue.
(a) Dorsal view of a representative mouse hemisphere showing Pvalb (green, AF-647) and Vglut1 (red, AF-594) labeling in down-sampled image volume (b) Volume rendered view showing cellular resolution in ventral hippocampus and cortex (parts of lateral entorhinal cortex) in an extracted sub-volume. (c-d) Dorsal views of a different z-plane than (a) showing Pvalb and Vglut1 FISH signal. Insets, zoomed-in view. Images are pseudocolored for the overlaying purpose. Scale bars (μm) - (a) 1500; (b) 300; (c-d) 1000 (Inset-200).

