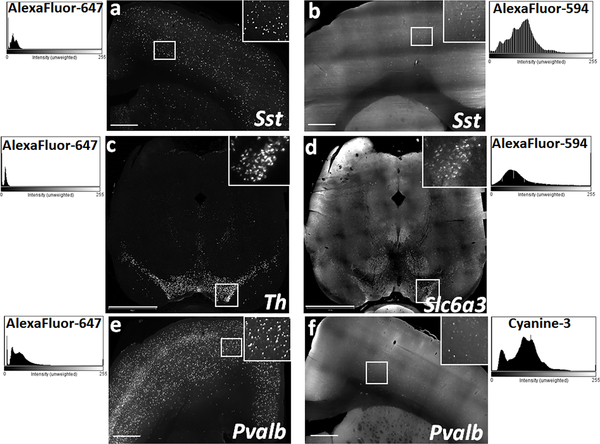
Fig. 7. Fluorophore based differences in the quality of fluorescence output imaged using light sheet microscope.
Representative xy-plane images of Sst labeled neurons in rat cortical slices using DNA hairpins conjugated with (a) AF-647 and (b) AF-594. Representative xy-plane images of rat mid-brain slices following multiplexed HCR FISH for two abundantly expressed genes in the substantia nigra and ventral tegmental area - (c) Th, detected with AF-647 and (d) Dat (Slc6a3) detected with AF-594. Comparison of the Pvalb signal in rat cortical tissue using DNA hairpins conjugated with (e) AF-647 and (f) Cy3. ImageJ generated histograms on the respective sides, show consistently high S/N ratio achieved with the use of AF-647 in comparison to the low S/N ratio with AF-594 or Cy3. Scale bars- (a, b, e, f) 500 μm; (c-d) 1200 μm.

