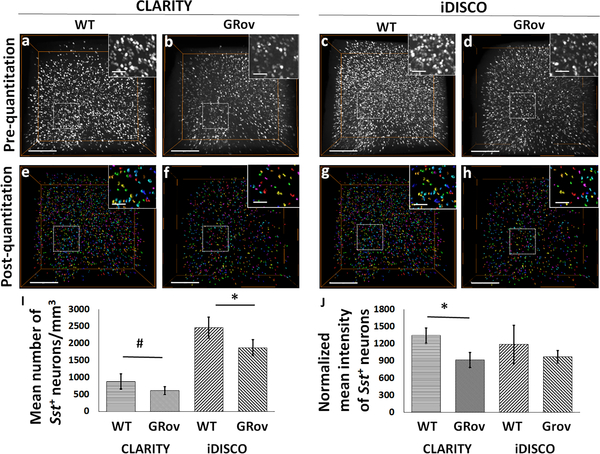
Fig. 8. GR overexpression negatively affects the expression of Sst in the analyzed cortical ROI of mice.
3D volume-rendered confocal images show qualitative visualization of Sst+ neuronal density in CLARITY- (a) WT, (b) GRov; and iDISCO+-(c) WT, (d) GRov. Surface-rendered images show post-quantitation volume density of Sst+ neurons in CLARITY- (e) WT, (f) GRov; and iDISCO+-(g) WT, (h) GRov. (i) Bar-diagram shows the significant difference in the number of Sst+ neurons between WT and GRov samples processed through CLARITY (cWT vs. cGRov) or iDISCO+ (iWT vs. iGRov). (j) Bar-diagram shows significant difference in the normalized mean intensity of Sst+ neurons between cWT and cGRov. #p=0.051; *p<0.05. Scale bars-300 μm (Inset bars-100 μm).

