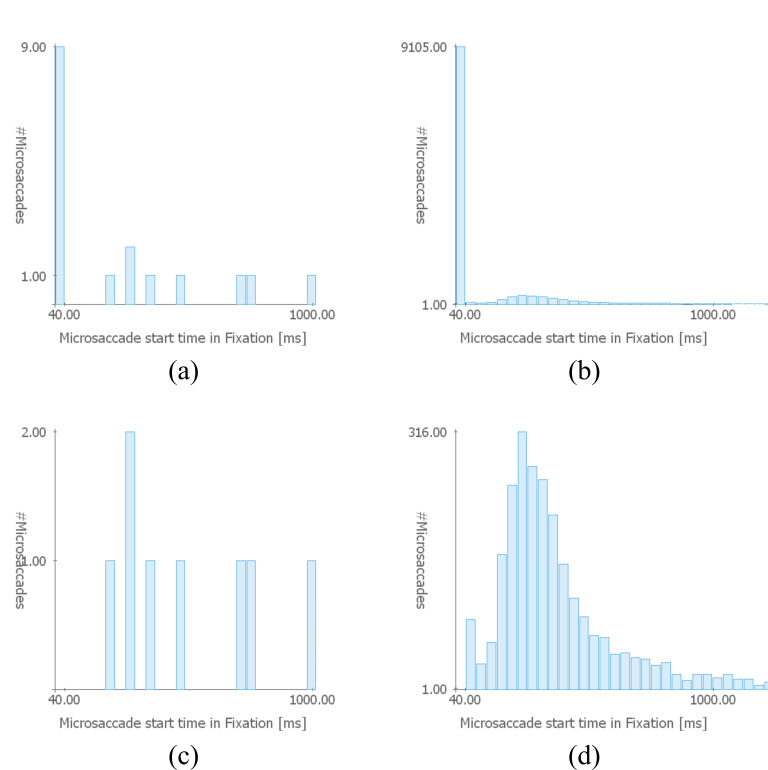
Figure 6.
Temporal positions of detected microsaccades as a histogram for (a) one trial and (b) all trials of all participants in the painting data set (bin size: 40 ms). A high peak in the first bin indicates that many glissades (overshoots right after saccades, here in the subsequent 40 ms) were detected as microsaccades. Figures (c) and (d) show the same data when all microsaccades within the first 40 ms of a fixation are ignored from the analysis.

