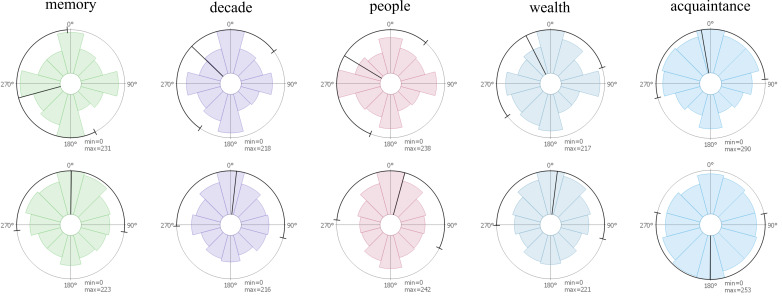
Figure 7.
Rose plots for microsaccade distributions for the 4 different tasks of the photo data set (memory, decade, people, and wealth) and the painting data set (acquaintance). First row: directions of microsaccades in screen coordinates as visible on the stimulus. Second row: microsaccade directions in local coordinates: they are rotated in such a way that 0° means that a microsaccade is in the direction to the next fixation. Min and max specify the values in the middle of the plot and on the circle, respectively; values are measured in microsaccade count.

