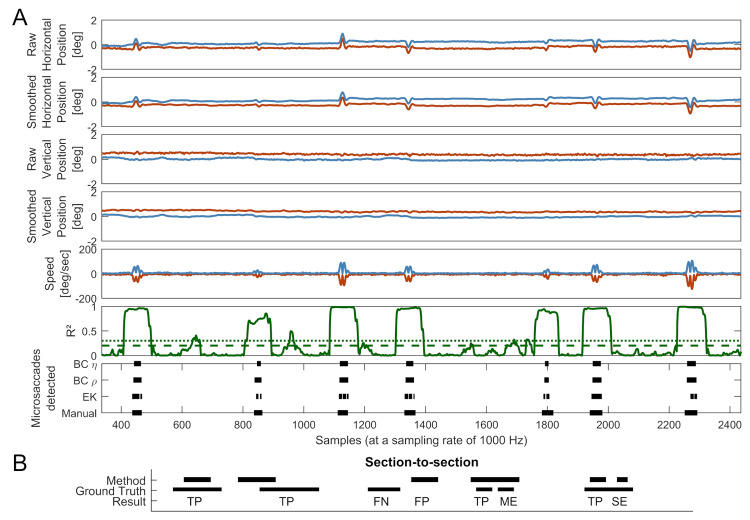
Figure 4.
A: Comparison of microsaccade detection methods and their mapping onto smoothed gaze data, speed and correlation profiles for P4. The red lines indicate data from the left eye and the blue lines indicate data from the right. The green solid line represents the moving correlation of the speeds between both eyes with a window size of 65 ms. The corresponding finely dashed green line represents a η value of 7 and the coarsely dashed green line indicates a ρ value of .45. A total of just over 2000 samples or 2 seconds is shown. Note: Speed in the left eye is represented as negative to facilitate readability of the graph. B: Graphical explanation of how the ground truth and detection method were compared. TP: true positive; FN: false negative; FP: false positive; ME: merged event; SE: split event. Further explanation is given in the text.

