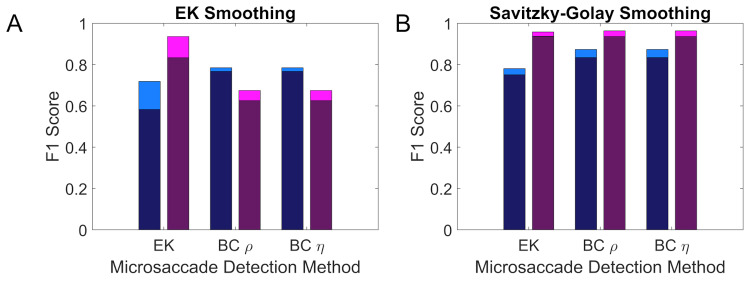
Figure 6.
Transferability of the different detection methods between datasets. The deeply coloured section of each bar indicates performance when transferring the optimal parameters for one of the two datasets to the other, while the lightly coloured section of each bar indicates the added benefit from using the optimal parameters for each dataset. Results for the Oxford dataset are given in blue, while the results for the Lund dataset are given in purple. Panel A shows the transferability using data smoothed with a Savitzky-Golay filter and panel B shows data smoothed using the EK filter.

