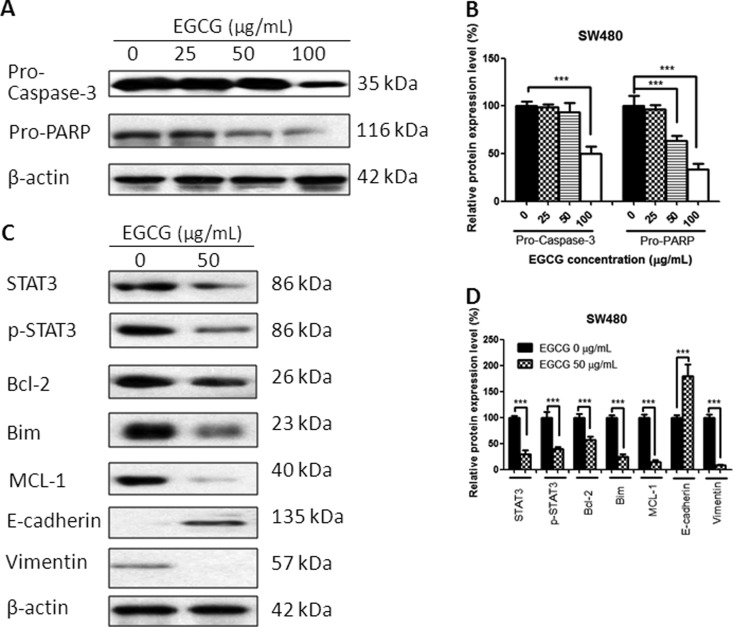
Figure 5.
Effect of EGCG on protein expression in SW480 cells. (A) Representative images of Western blot of Caspase-3 and PARP in SW480 cells after treatment with EGCG. (B) Statistical analysis of Caspase-3, PARP in SW480 cells after EGCG treatment. (C) Representative images of Western blot of STAT3, Bcl-2, Bim, MCL-1, E-cadherin, and Vimentin after treatment with EGCG. (D) Statistical analysis of STAT3, p-STAT3, Bcl-2, Bim, MCL-1, E-cadherin, and Vimentin in SW480 cells after EGCG treatment. Data are shown as mean + SD (n = 3). **P < 0.01 and ***P < 0.001, as compared with untreated control.

