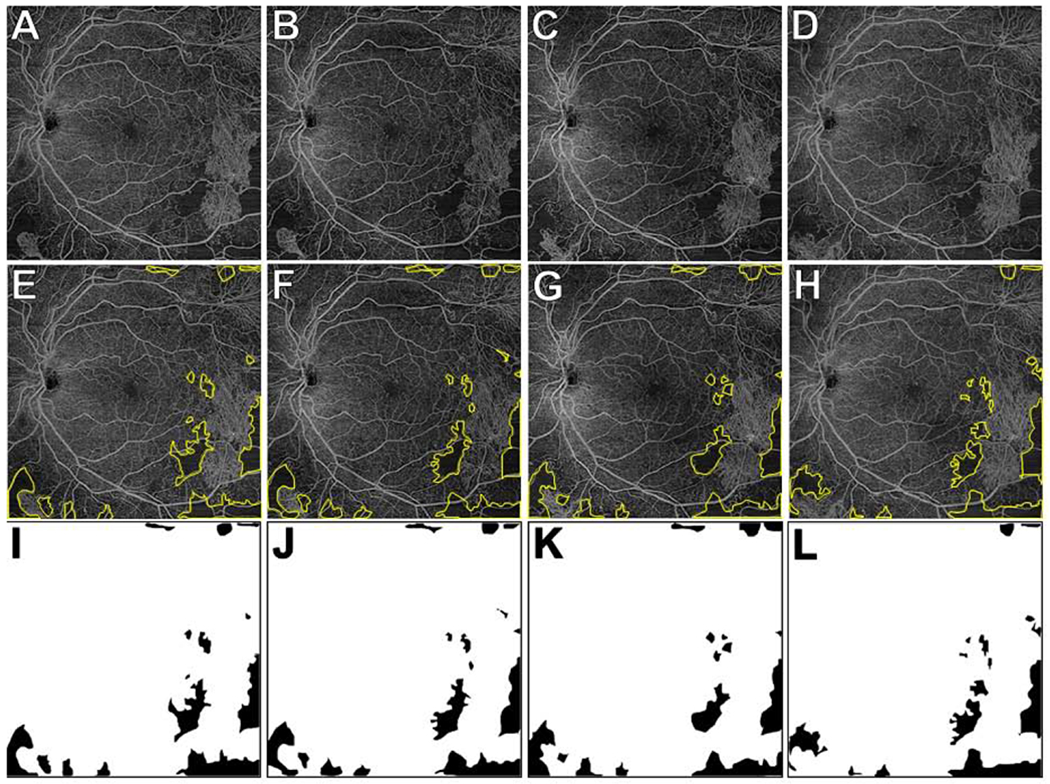
Figure 4. Retinal non-perfusion (RNP) areas on wide-field (WF) swept-source (SS) OCT angiography (OCTA) of a representative eye with proliferative diabetic retinopathy (PDR) after panretinal photocoagulation (PRP).

(A-D) WF SS-OCTA 12x12mm total retinal vasculature images at baseline (A), 1 week (B), 1 month (C), and 3 months (D). The consensus graded RNP areas are outlined in yellow in (E-H) and as black areas in (I-L). In this eye, the RNP% was 7.78%, 7.69%, 7.56%, and 6.70% at the baseline, 1 week, 1 month, and 3 month visits, respectively. There were small differences between visits in RNP areas but these likely reflected the inherent imprecision of the imaging and/or RNP analysis rather than physiological changes in RNP.
