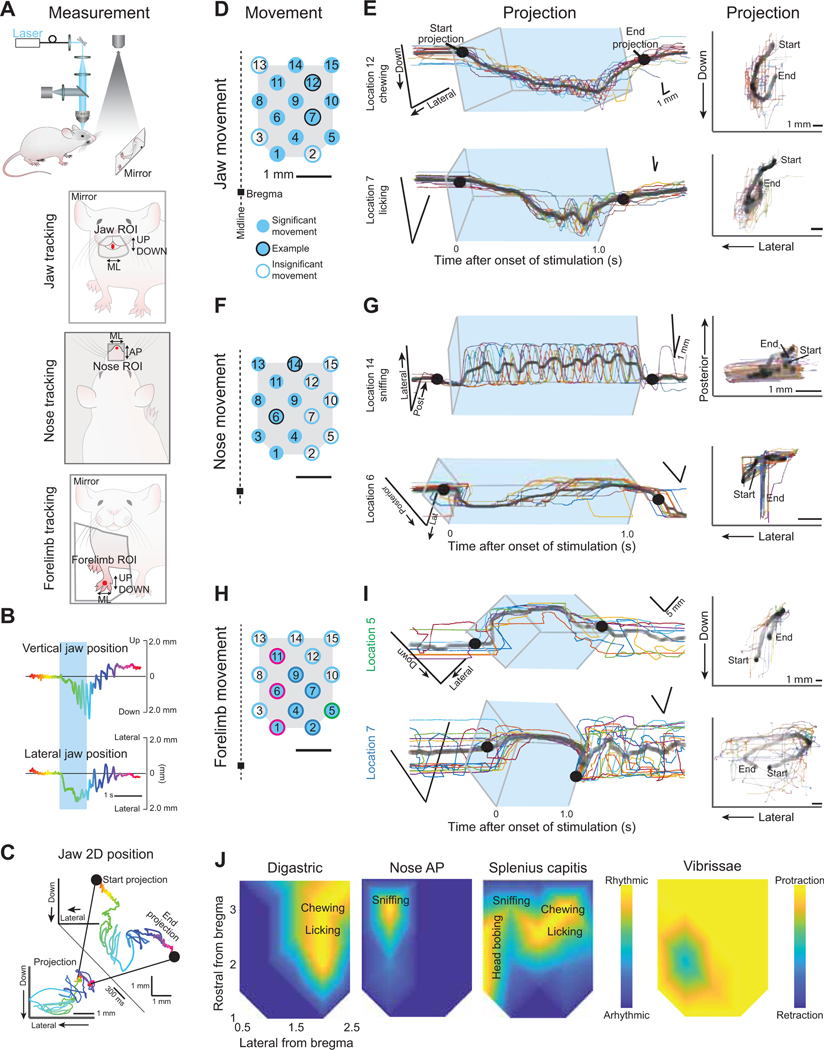
Figure 2. Mapping orofacial motor cortex-evoked forelimb, jaw, and nose movements, as inferred from videography.
(A) Schematic of the videographic recording set up with the mirror image shown for tracking the jaw (left) and forelimb (right) and for the videography from above as done for the nose (middle).
(B) Single trial example of vertical (top) and lateral (bottom) jaw position.
(C) Conversion of single dimension positions in Figure 2B to two-dimensional projection. Black dots illustrate the start and end of the projection (insert) that shows the movement path as observed looking on directly in the dimension of the mirror (forelimb and jaw) or from above (nose).
(D) Motor cortex stimulation points as seen in Figure 1C. Filled blue circles indicate locations where visible jaw movements were observed; black outlined circles indicate location from which jaw tracking examples are shown in Figure 2E. Movements were similarly observed in all five mice.
(E) Jaw movements in 2-D over time (left) with projected trajectory (right). All trials are shown (colored lines) with the average (black). In the projection, darker lines indicate more time was spent at those coordinates. The blue box indicates the stimulation duration.
(F) Same as Figure 2D but here filled blue circles indicate locations where visible nose movements were observed and black outlined circles indicate the example locations for traces in Figure 2G. Movements were similarly observed in three mice.
(G) Nose movements in two dimensions over time (left) and projected trajectory (right). All trials are shown (colored lines) with the average (black). In the projection, darker lines indicate more time was spent at those coordinates. The blue box indicates the stimulation duration.
(H) Similar to Fig. 2D and F, here filled blue circles indicate locations where forelimb movements were tracked and recorded. Colored outlines indicate which movement type (clusters 1, 2, or 3 as seen in Fig. 3A,B) was evoked from laser activation at that location. Movements were similarly observed in three mice.
(I) Forelimb movements in 2-D over time (left) with projected trajectory (right). All trials are shown (colored lines) with the average (black). In the projection, darker lines indicate more time was spent at those coordinates. The blue box indicates the stimulation duration. An example each for clusters 1 and 2 are shown with the example for cluster 3 in Fig. S2D.
(J) Composite maps of locations with rhythmic activity of the digastric (top) and splenius capitis (bottom) muscles along with rhythmic nose movements (middle). Movement descriptions are overlaid. The vibrissa map shows net movement; details are in Figure S1.

