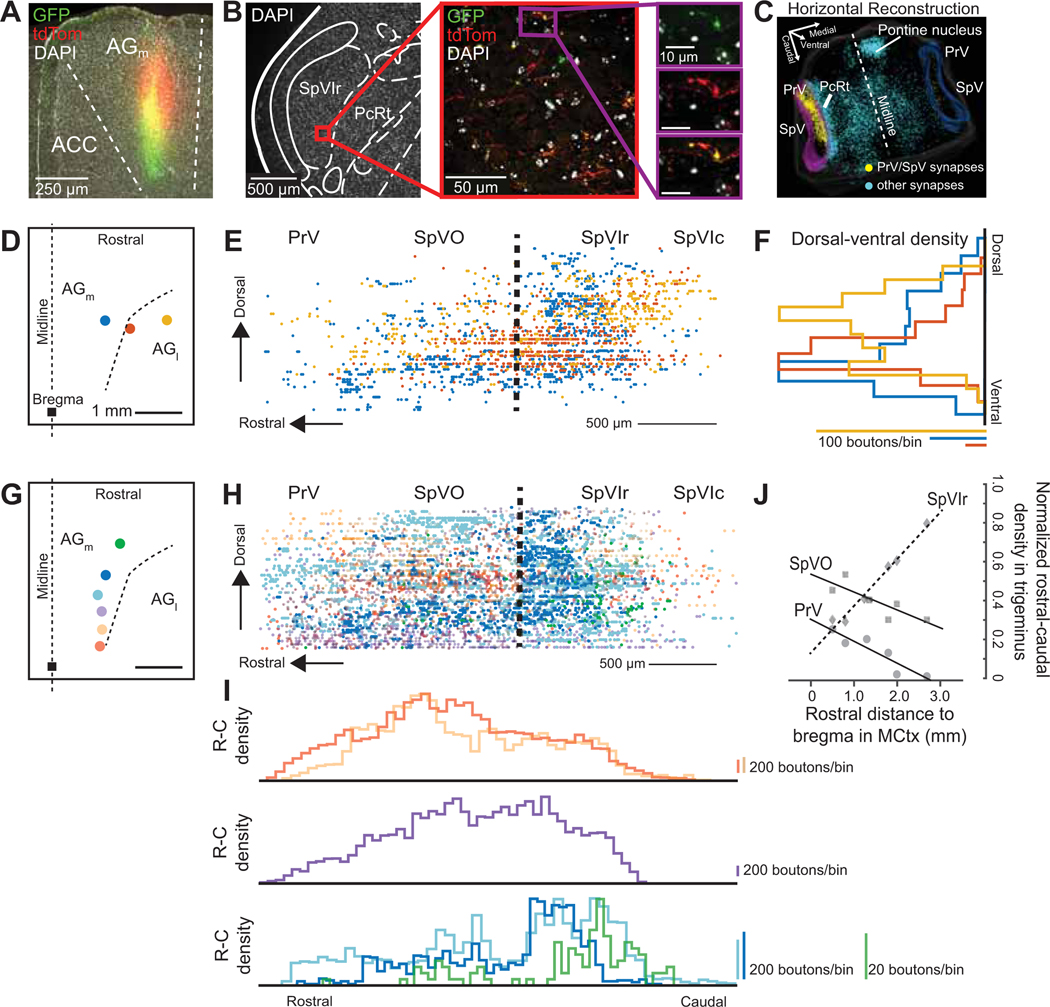
Figure 5. Density of inputs from motor cortex biases within the spinal trigeminal complex dependent on cortex location.
(A) Lentivirus-CAG-synaptophysin-eGFP coinjected with AAV-hSyn-tdTomato in the AGm region of motor cortex. No spill was found in anterior cingulate cortex (ACC).
(B) Synapses (green and red) and axons (red only) labeled in SpVIr from panel A.
(C) 3-D reconstruction of GFP-labeled boutons of the hindbrain viewed from above.
(D) Schematic of motor cortex injections in AGm and lateral to AGl, the square represents bregma. Each colored circle corresponds to one injection in one mouse.
(E) Sagittal projection of synapses labeled rostrally from PrV through SpVIc caudally color coded by injection site in panel D (4,848 synapses across three mice).
(F) Overlaid histograms of dorsal – ventral density in PrV through SpVIc for injections in AGm and AGl, scaling information shown below.
(G) Schematic of motor cortex injections in AGm that run along the rostral – caudal axis. Each dot corresponds to one mouse.
(H) Sagittal projection of synapses labeled rostrally from PrV through SpVIc caudally color coded by injection site in panel F (17,226 synapses across six mice). Some data sets were down sampled for clarity.
(I) Histograms of rostral – caudal density from color coded injection sites in panel G, scaling information shown on the right.
(J) Plot of percent synaptic density in PrV, SpVO, and SpVIr out of all trigeminal synapses (PrV + SpVO + SpVIr + SpVIc) as the injections move rostral from bregma.

