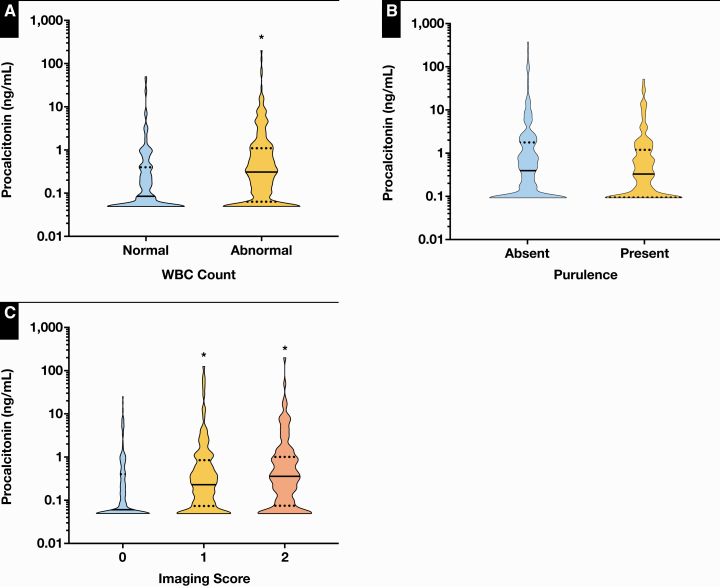
Figure 3.
Association between procalcitonin (PCT) results and other diagnostic workup for lower respiratory tract infections (LRTIs). A, Median PCT levels were significantly higher in patients with abnormal (0.31 ng/mL; 95% confidence interval [CI], 0.23-0.40 ng/mL) vs those with normal WBC count (0.08 ng/mL; 95% CI, 0.07-0.14 ng/mL). B, Median PCT levels were not significantly different in patients with purulent (0.18 ng/mL; 95% CI, 0.12-0.25 ng/mL) vs those with nonpurulent Gram stains (0.21 ng/mL; 95% CI, 0.13-0.31 ng/mL). C, Median PCT levels were significantly higher in patients in whom bacterial pneumonia could not be ruled out (0.25 ng/mL; 95% CI, 0.16-0.35 ng/mL) or was confirmed (0.33 ng/mL; 95% CI, 0.23-0.48 ng/mL) compared with those with no evidence for bacterial pneumonia (0.06 ng/mL; 95% CI, 0.05-0.10 ng/mL) by chest imaging (0, no evidence of pneumonia; 1, cannot rule out bacterial pneumonia; 2, consistent with bacterial pneumonia). Black bars in the violin plots represent the median. Dotted black lines represent the upper and lower quartiles. *P < .0001 compared with group 0.

