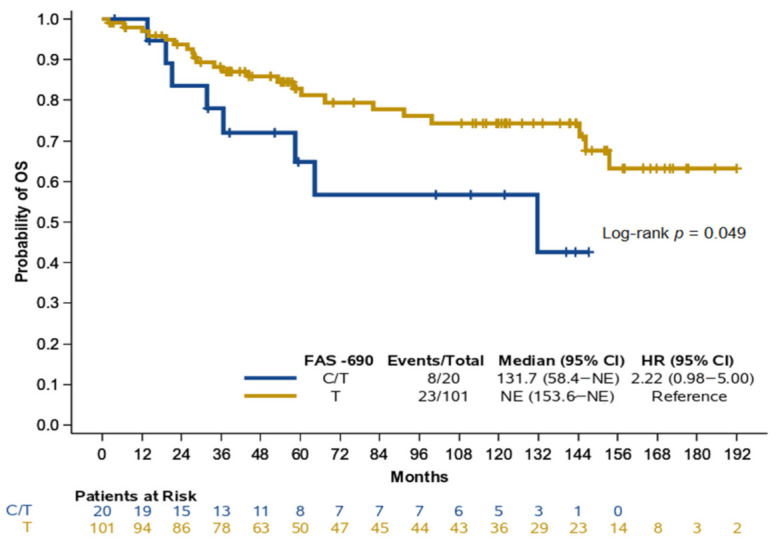
Figure 2.

Kaplan–Meier curves for OS according to FAS −690 genotypes in NPC patients. HR: hazard ratio, CI: confidence interval, NE: not estimable.

Kaplan–Meier curves for OS according to FAS −690 genotypes in NPC patients. HR: hazard ratio, CI: confidence interval, NE: not estimable.