. 2021 Mar 15;9(3):e24497. doi: 10.2196/24497
©Qinlai Liu, Wenping Sun, Changqing Du, Leiying Yang, Na Yuan, Haiqing Cui, Wengang Song, Li Ge. Originally published in JMIR Medical Informatics (http://medinform.jmir.org), 15.03.2021.
This is an open-access article distributed under the terms of the Creative Commons Attribution License (https://creativecommons.org/licenses/by/4.0/), which permits unrestricted use, distribution, and reproduction in any medium, provided the original work, first published in JMIR Medical Informatics, is properly cited. The complete bibliographic information, a link to the original publication on http://medinform.jmir.org/, as well as this copyright and license information must be included.
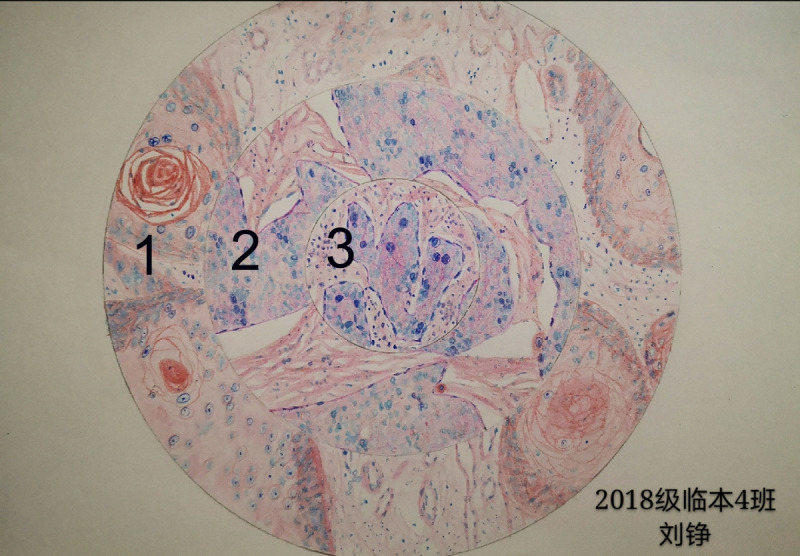
Figure 3.

Representative image of pathological sections at low (1), medium (2) and high resolution power (3).
