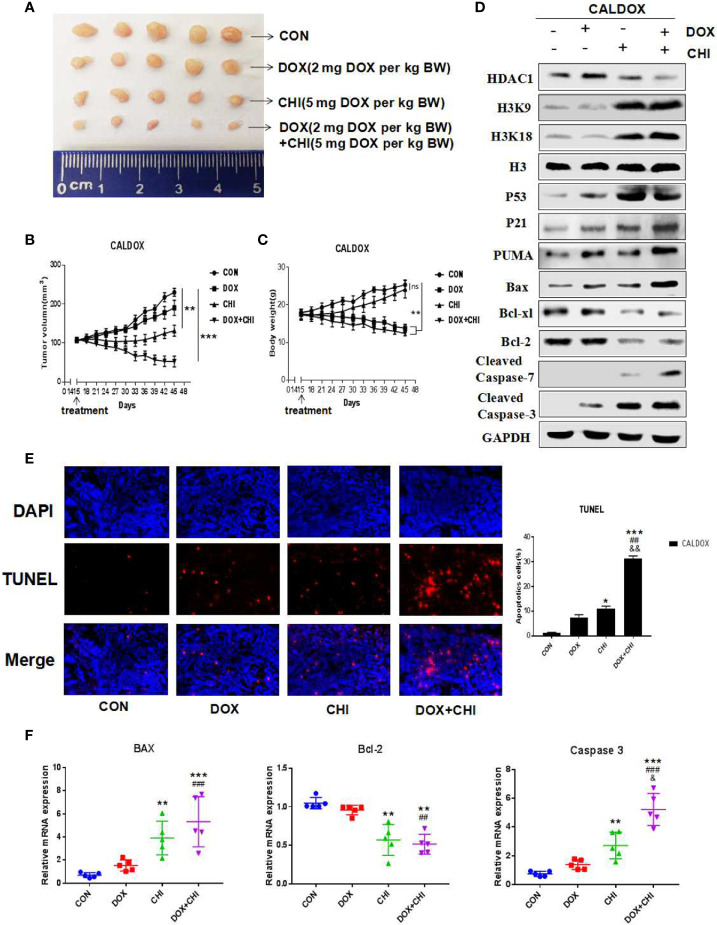
Figure 5.
Antitumor activity of chidamide (CHI) and/or doxorubicin (DOX) in MDA breast cancer cells in vivo. (A–C) CALDOX xenograft tumor growth curve, size, and body weight after treatment with normal saline (control), DOX, CHI or CHI + DOX. (D) Western blot analysis of HDAC1, H3K9, H3K18, p53, p21, Puma, Bcl-xl, Bcl-2, cleaved caspase-7, cleaved caspase-3, and Bax on CALDOX-derived tumors treated with PBS (control), DOX, CHI, or CHI + DOX. (E) TUNEL staining analyzed cell apoptosis after treatment with normal saline (control), DOX, CHI, or CHI + DOX. (F) Relative fold change of Bax, Bcl-2, and caspase-3 gene expression levels in CALDOX-derived tumors treated with normal saline (control), DOX, CHI, or CHI + DOX. The numerical values are showed as mean ± SD of three independent replicates. “*” indicates a significant difference compared with the control group (*P < 0.05, **P < 0.01,***P<0.001),”#” indicates a significant difference compared with the DOX-treated group (##P < 0.01, ###P < 0.001), and “&” indicates a significant difference compared with the CHI-treated group (&P < 0.05, &&P < 0.01). ns, no significance.

