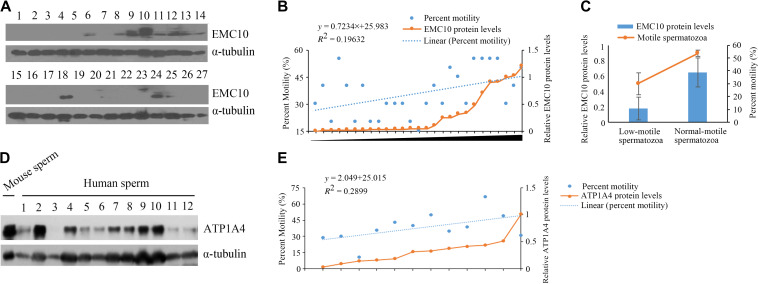
Figure 7.
The correlation of EMC10 or ATP1A4 protein level with sperm motility in humans. (A, B, D, and E) Immunoblot (IB) analysis was performed to determine the levels of EMC10 (A) and ATP1A4 (D) in sperm protein derived from asthenozoospermic patients and male controls. The scatter diagram shows the motile spermatozoa percentage and the relative protein levels of EMC10 (B) or ATP1A4 (E). The percentage of motile spermatozoa was quantified by ImageJ software (v2.1). The linear regression analysis was analyzed by using the Statistical Package for the Social Sciences (SPSS 20.0) software program. (C) The histogram shows motile sperm percentage and the relative protein levels of EMC10. Data are presented as mean ± SD, **P < 0.01.

