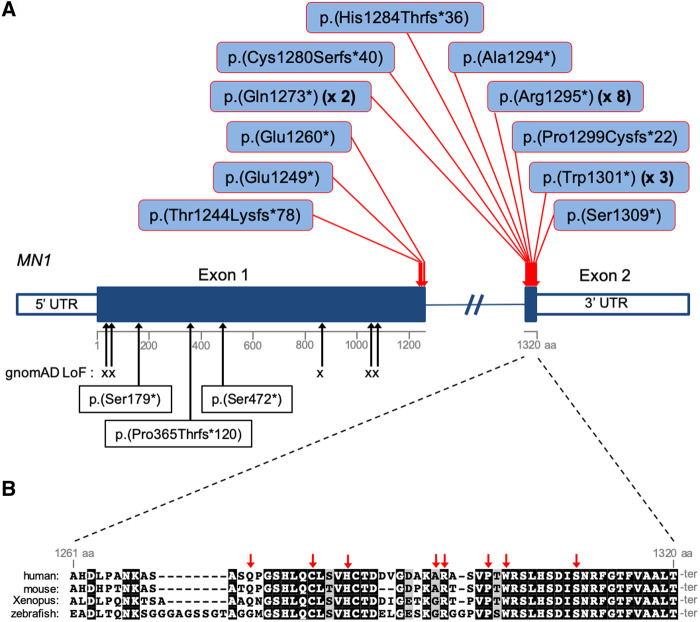
Figure 1.
MN1 mutations and sequence conservation. (A) Distribution of C-terminal truncating mutations identified in MN1 in 21 probands (red arrows). Beneath the schema of the gene, black arrows indicate the positions of loss-of-function variants in the gnomAD database and p.(Ser179*), p.(Pro365Thrfs*120) and p.(Ser472*) identified in Individuals 24, 25 and 26, respectively. (B) MN1 C-terminal sequence conservation. Multi-species sequence alignment of the entire exon 2 coding region of MN1. Sequences were obtained from the following RefSeq or Ensembl transcripts: human, NM_002430.2; mouse, NM_001081235.1; Xenopus, NM_001100202.1; zebrafish, ENSDART00000129197. Red arrows indicate the positions of the mutations identified in exon 2.

