Abstract
There is growing evidence on the clinical significance of tumor microenvironment (TME) cells in predicting prognosis and therapeutic effects. However, cell interactions in tumor microenvironments have not been thoroughly studied or systematically analyzed so far. In this study, 22 immune cell components in the lung adenocarcinoma (LUAD) TME were analyzed using gene expression profile from The Cancer Genome Atlas (TCGA) and Gene Expression Omnibus (GEO). The TME-based molecular subtypes of LUAD were defined to evaluate further the relationship between molecular subtypes, prognosis, and clinical characteristics. A TME risk score model was constructed by using the differentially expressed genes (DEGs) of molecular subtypes. The relationship between the TME score and clinical characteristics and genomic mutations was compared to identify the genes that have significant associations with the TME. The comprehensive analysis of the TME characteristics may be helpful in revealing the response of LUAD patients to immunotherapy, providing a new strategy for immunotherapy.
Key words: Tumor microenvironment, Lung adenocarcinoma, The Cancer Genome Atlas (TCGA), Gene Expression Omnibus (GEO), Immunotherapy
INTRODUCTION
Tumor microenvironment (TME) is the internal environment in which tumor cells are produced and inhabit. This includes not only the tumor cells themselves but also various cells, such as fibroblasts, immune and inflammatory cells, the cell mesenchymal, microvessels, and biomolecules infiltrating the surrounding area1. Recently, numerous studies have suggested that TME plays an essential role in the occurrence and development of tumors2. Under the recruitment of tumor-related signals, a variety of immune cell components in the microenvironment interact closely with cancer cells and then evolve to promote tumor development3–5. The physiological status of the TME is closely related to each step of tumorigenesis. There is growing evidence that they can play an essential role in the prognosis of clinical pathology and the prediction of the therapeutic effect6. When tumors occur, there are some differences in the composition of immune cells in the TME, such as cytotoxic T cells, helper T cells, dendritic cells (DCs), tumor-associated macrophages (TAMs), and mesenchymal stem cells (MSCs)7–9. The changes in the number of infiltrating CD8+ T cells, CD4+ T cells, macrophages, and cancer-associated fibroblasts in the TME are also associated with clinical results10,11. Therefore, a full understanding of the role of immune cells in the TME and its effects on cancer cells will help in the discovery of novel prognostic elements of lung adenocarcinoma (LUAD)12. However, in several cancer tumors, the cellular interactions in the TME have not been thoroughly studied or systematically analyzed yet.
The identification of molecular signatures is currently a hot topic in tumor research since they play an essential role in the early diagnosis, early warning, and prognosis of LUAD13. Molecular signatures are based on the functional study of individual genes but emphasize the coordination between multiple genes, describing biological characteristics at the overall systematic levels14. Gene expression profile analysis is an essential means to obtain molecular signatures. With the development of gene chip technology, researchers can study changes in gene expression profiles at the whole genome level, understanding the relationship between gene expression and tumor occurrence, development, and metastasis as a whole15. Gene expression profile data analysis can be used to identify gene expression patterns composed of more genes and in the further selection of a certain number of genes to represent their biological characteristics16. On this basis, the molecular subtyping of tumor origin, metastasis potential, and responsiveness to radiotherapy and chemotherapy can also be accomplished17. For example, Chang et al.18 analyzed the continuous sequences of 295 patients with early stage breast cancer and established a wound-response gene expression signature for the molecular typing of patient samples that can be used to predict the survival rate of breast cancer patients. Many characteristic molecular signatures can be found by comprehensive analysis of molecular signatures with clinical features such as metastasis, recurrence, and prognosis. Molecular signatures are related to the clinical features of patients and are essential tools for determining clinical diagnosis, judging prognosis, and selecting treatment options19. Brenton et al.20 reviewed the application of gene expression profile analysis in cancer typing research and concluded that this analysis could enable a better understanding of the molecular differences between clinical cases, contributing to individualized therapy.
Therefore, this study analyzed 22 typical immune cells in LUAD TME by using gene expression data from public databases such as The Cancer Genome Atlas (TCGA) and Gene Expression Omnibus (GEO). On this basis, a set of TME scoring systems was constructed to evaluate the prognosis of LUAD samples with TME scores. By further comparing the relationship between the TME and genomic mutation, a group of genes associated with the TME was found. In conclusion, a comprehensive analysis of the TME characteristics of LUAD may help to reveal the response of LUAD patients to immunotherapy, providing a new strategy for LUAD immunotherapy.
MATERIALS AND METHODS
TCGA Data Download and Preprocessing
We used the TCGA Genomic Data Commons (GDC) Application Programming Interface (API) to download the latest clinical follow-up information. Supplemental Table S1 (this and all supplemental figures and tables available at https://github.com/lingbo268/lingbobioinformatics) contains 522 samples of RNA-Seq data. We preprocessed the RNA-Seq read count data of the 522 samples in the following steps. Samples without clinical data and samples of overall survival (OS) <30 days were removed. Normal tissues were removed. The read count was converted to TPM using the annotation information of GENCODE v22 since the distribution of TPM data and chip data is closer than that of FPKM. The genes with a TPM of 0 in half of the samples were removed.
GEO Data Download and Preprocessing
The GSE37745 chip expression data in MINiML format were downloaded from NCBI. GSE37745 contains 196 samples with clinical features, of which 107 samples are LUAD. The non-LUAD samples were removed in the subsequent analysis (relevant data are provided in supplemental Table S2. We preprocessed the GSE37745 data in the following steps. We removed healthy tissue sample data and retained only primary tumor data. OS data in year or month format were converted to days. Samples with OS <30 days were removed. The chip probes were mapped into the human gene SYMBOL using the Bioconductor package. The statistical information of the data set after preprocessing is shown in Table 1.
Table 1.
Clinical Information of Two Groups of Data Sets After Preprocessing
| Clinical Features | TCGA | GSE37745 |
|---|---|---|
| Event | ||
| Alive | 311 | 29 |
| Dead | 178 | 76 |
| Tumor | ||
| T1 | 1 | 162 |
| T2 | 2 | 263 |
| T3–T4 | 61 | |
| TX | 3 | |
| Node | ||
| N0–N1 | 409 | |
| N2–N3 | 70 | |
| NX | 10 | |
| Metastasis | ||
| M0 | 324 | |
| M1 | 24 | |
| MX | 141 | |
| Stage | ||
| I–II | 377 | 89 |
| III–IV | 104 | 16 |
| X | 8 | |
| Adjuvant treatment | ||
| No | 39 | |
| Yes | 15 | |
| Recurrence | ||
| No | 26 | |
| Yes | 26 | |
| Gender | ||
| Female | 262 | 60 |
| Male | 227 | 45 |
| Age | ||
| 0–50 | 43 | 7 |
| 51–60 | 99 | 34 |
| 61–70 | 166 | 33 |
| 71–80 | 152 | 29 |
| 81–100 | 29 | 2 |
| Smoking | ||
| S1 | 68 | |
| S2 | 115 | |
| S3 | 126 | |
| S4 | 162 | |
| S5 | 4 | |
| SX | 14 | |
Calculating the Score of Infiltrating Cells in the TME
CIBERSORT is a deconvolution algorithm that uses a set of reference gene expression values (a signature with 547 genes) considered a minimal representation for each cell type, and based on those values, it infers cell type proportions in data from bulk tumor samples with mixed cell types using support vector regression. CIBERSORT can distinguish 22 types of human immune cells, including B cells, T cells, natural killer (NK) cells, macrophages, DCs, and myeloid subset cells based on the high specificity and sensitivity of gene expression data.
To quantify the proportion of immune cells in LUAD samples, we used the CIBERSORT algorithm21 and the LM22 gene signature as a reference to calculate the scores of 22 immune cells in the TCGA LUAD and GSE37745 data sets. Specifically, the gene expression data were uploaded to the CIBERSORT website (http://cibersort.stanford.edu/). The scores of 22 immune cells were obtained using LM22 signatures and 1,000 permutations.
Dimension Reduction and Generation of TME Gene Signatures
To obtain robust TME gene signatures, we first analyzed the prognostic value of each differentially expressed gene (DEG) and selected genes with significant prognoses. The random forest algorithm was further used to evaluate the importance of these DEGs. Univariate survival analysis is performed accurately using the coxph function of the R software package survival. We selected a threshold of 0.05 in the random forest algorithm specifications to incorporate genes with a significant prognosis. The random forest package was used to set the mtry of each partition to 1–165 and ntree = 500. The mtry value with the lowest error rate was set as the optimal mtry value of the random forest algorithm. Then, ntree = 100 was selected according to the error rate of the random forest algorithm. Ultimately, each DEG is sequenced by its importance, and DEGs with cumulative importance greater than 95% are selected as candidate feature genes. K-means was used to classify these genes into four categories22. The principal component (PC) analysis of the expression profiles of the four types of genes was carried out by using the R package psych. The first PC was extracted as a signature score after 100 iterations. The advantage of this approach is that it focuses on the score in the set with the largest block of well-correlated (or anticorrelated) genes in the set while down weighting contributions from genes that do not track with other set members. For the No.j category genes, the signature score formula for the sample is as follows:
where j represents the No.j category of the five types of genes, n j represents the number of genes in the No.j category genes, Pc1i represents the first primary component coefficient of the No.i gene of the No.j category genes, and Expi represents the expression level of the No.i gene of the No.j category genes. Ultimately, the risk coefficient of each signature score is obtained by using the signature score of four types of genes in each sample according to multivariate regression. The TME score formula for any sample is as follows:
where j represents the No.j category of the five types of genes, S j represents the signature score of samples in the No.j category genes, and βj represents the risk regression coefficient of the signature score of No.j category genes.
Relationship Between TME Score and Clinical Features
In order to observe the relationship between TME score and clinical phenotypes, the samples were divided into two groups according to the median TME score. The prognostic differences between the high TME score and the low TME score were compared. The same analysis was conducted to analyze the relationship between high TME score and low TME score and age and gender.
Relationship Between TME Score and Immune-Related Gene Expression
To observe the relationship between TME score and immune-related genes, we compared the distribution of immune genes on TMEC, GeneC, and TME score that characterize immune activation status.
Relationship Between TME Score and Tumor Genome Mutation
The patients were divided into Risk-H and Risk-L groups by TME score. We compare the relationship between TME score and genome mutation and identify a group of important genes related to TME score. Genes with significant differences in mutation frequencies in the Risk-H and Risk-L samples were compared (Fisher tests, p < 0.001).
Western Blotting
Western blotting was carried out according to the standard protocols described previously23. We used primary antibodies raised against glyceraldehyde 3-phosphate dehydrogenase (GAPDH), SPP1, and UBE2T (Santa Cruz Biotechnology, Santa Cruz, CA, USA), as well as BIRC5, GJB2, and SLC2A1 (Proteintech, Wuhan, China). Goat anti-mouse and anti-rabbit antibodies conjugated with horseradish peroxidase were used as secondary antibodies (Jackson ImmunoResearch, West Grove, PA, USA), and we detected the blots using enhanced chemiluminescence (ECL) (Dura, Pierce, NJ, USA).
RNA Extraction and Real-Time Polymerase Chain Reaction (PCR) Assay
Total RNA was extracted using TRIzol reagent (Invitrogen, Carlsbad, CA, USA) following the manufacturer’s protocol and was reverse transcribed into complementary DNA (cDNA) using a Superscript Reverse Transcriptase Kit (Transgene, Strasbourg, France). Super SYBR Green Kit (Transgene) was used to carry out real-time PCR in ABI7300 real-time PCR system (Applied Biosystems, Foster City, CA, USA). The primers pairs were BIRC5 AGGACCACCGCATCTCTACAT (forward) and AAGTCTGGCTCGTTCTCAGTG (reverse); GJB2 ATGTACGACGGCTTCTCCAT (forward) and GCAGGATGCAAATTCCAGACAC (reverse); SLC2A1 CTGCTCACGAATCTCTGGTCC (forward) and GCCTAATAGCACCGGCCATAG (reverse); SPP1 GCCGCTGTAACCTCTTCGG (forward) and GTCTTCGGCCAATCTGGCTTT (reverse); and UBE2T ATCCCTCAACATCGCAACTGT (forward) and CAGCCTCTGGTAGATTATCAAGC (reverse).
Statistical Analysis
In addition to certain specifications, the normality of variables was tested by the Shapiro–Wilk normality test24. For the comparison between the two groups, the statistical significance of normally distributed variables was estimated by unpaired Student’s t-test. The non-normally distributed variables were analyzed by the Mann–Whitney U-test. The Kruskal–Wallis test and univariate variance analysis were used as nonparametric and parametric methods25, respectively, for more than two groups of comparisons. The correlation coefficients were calculated by Spearman and distance correlation analysis. Fisher’s exact test was used to analyze the contingency table. Benjamini–Hochberg method was used to convert p value to false discovery rate (FDR). Similarly, Kaplan–Meier method was used to generate survival curves for each subgroup in the data set. Log-rank test was conducted to determine the statistical significance of the differences, which is defined as p < 0.05. All of these analyses were performed in R 3.4.3, and all analyses were not specified with default parameters.
RESULTS
TME Analysis of LUAD
Calculating the Score of Infiltrating Cells in the TME
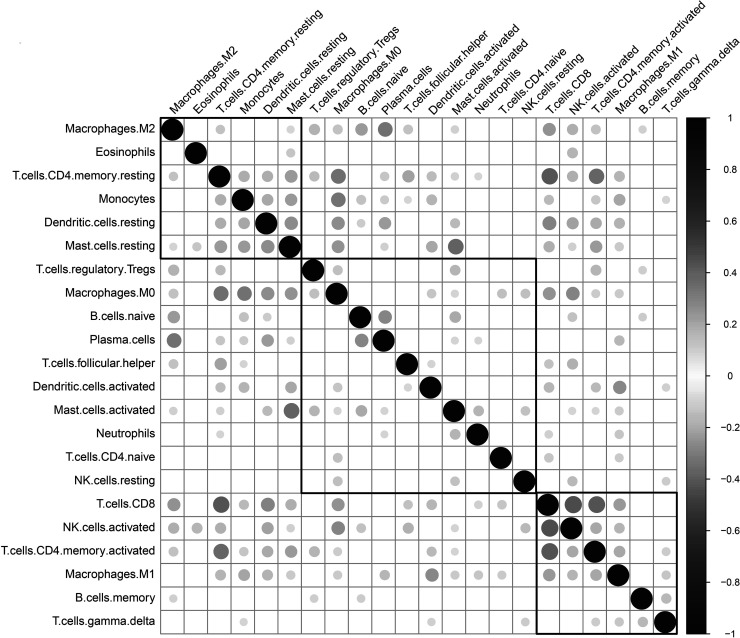
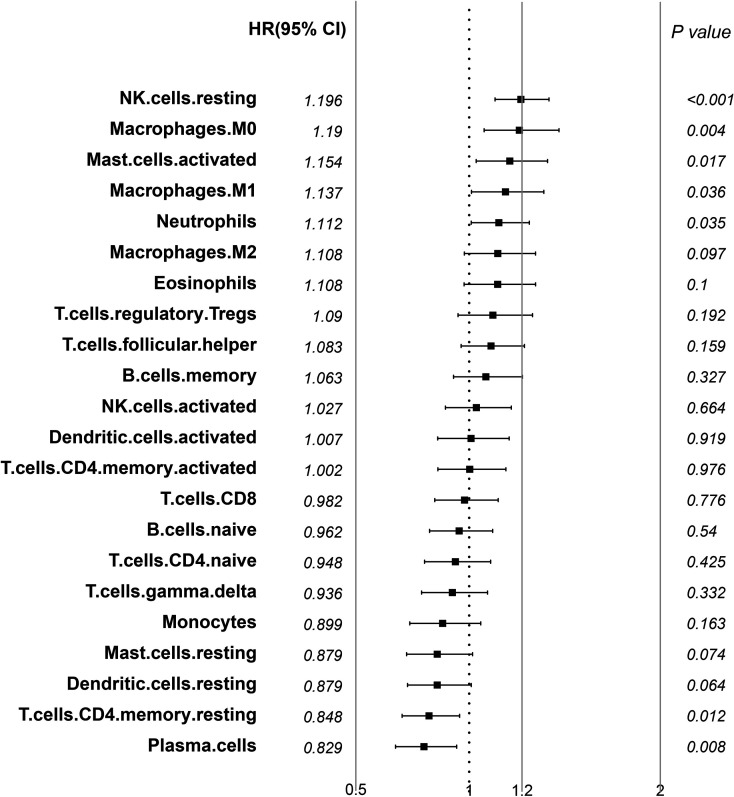
We applied the CIBERSORT (http://cibersort.stanford.edu/) tool and the LM22 gene signature as a reference to calculate the scores of 22 immune cells from the LUAD transcriptional group data of TCGA and GSE37745 (the permutation parameter was set to 1,000). The CIBERSORT algorithm uses a deconvolution support vector regression algorithm to infer the proportion of cell types in the data of a large number of tumor samples with mixed cell types with a set of minimum gene expression values representing each cell type as a reference (547 genes). CIBERSORT can distinguish 22 types of human immune cells, including B cells, T cells, NK cells, macrophages, DCs, and myeloid subset cells based on the highly specific and sensitive differences of gene expression data. The correlation between the scores of 22 immune cells shows that there are three distinct groups: two with a positive correlation and one with a negative correlation, reflecting a specific communication mode between immune cells (Fig. 1, supplemental Table S3). Using univariate Cox regression analysis of the relationship between the scores of 22 immune cells and prognosis, the scores of resting NK cells, M0 macrophages, and activated mast cells are significantly related to poor prognosis (log-rank p < 0.05). The scores of resting memory CD4 T-cells and plasma cells are related to better prognosis (log-rank p < 0.05). The results are elucidated in Figure 2, and the data are available in supplemental Table S4.
Figure 1.
Correlation of 22 immune cells in the TME.
Figure 2.
Forest plot of hazard ratio of 22 immune cells in the TME (log rank p < 0.05).
Molecular Typing of LUAD Based on TME Score
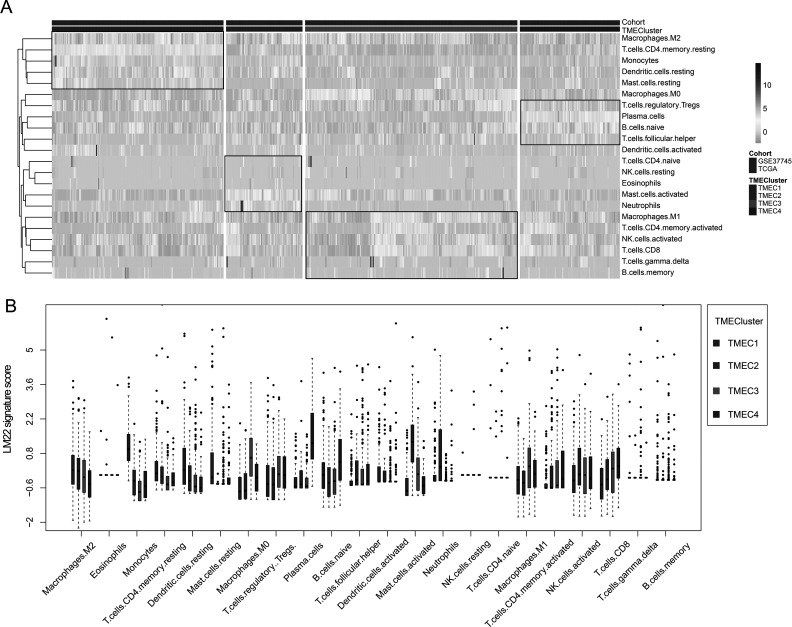
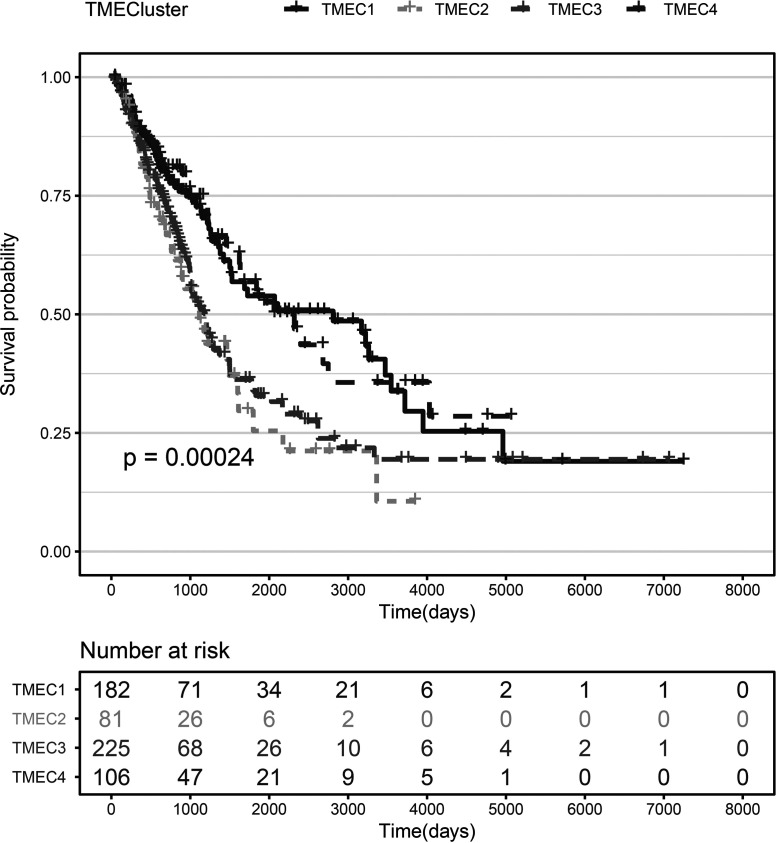
Based on the TME score, we use the consensus clusterPlus package to conduct unsupervised clustering of the TCGA+ GSE37745 samples. First, the scores of seven immune cells significantly related to prognosis were selected. The optimal number of clusters between k = 2–10 was evaluated, which was repeated 1,000 times. K = 4 was selected as an optimal clustering number (supplemental Fig. S1) according to the CDF value and Delta area. The four categories of TME scores as TMEC1–TMEC4 were defined. In terms of clustering results, M2 macrophages and resting memory CD4 T cells have significantly higher scores mainly in TMEC1, while plasma cells have higher scores mainly in TMEC4. M0 macrophages and activated mast cells have higher scores mainly in TMEC2 and TMEC3 (Fig. 3). OS prognostic analysis among the TMECs revealed that there is a significant difference in OS prognosis among the TMECs (log-rank p < 0.01). From the results, it is clear that TMEC1 and TMEC4 exhibited better prognosis than TMEC2 and TMEC3 (Fig. 4). Moreover, the OS prognostic relationship between TCGA and TMECs in GSE37745 is evaluated. The results revealed that there is a significant difference in OS prognosis among the TMECs in TCGA (p = 0.0079). Although GSE37745 failed to show such a significant difference (p = 0.078), there was a trend consistent with TCGA data (supplemental Fig. S2). Comparison of the scores of 22 immune cells in the TCGA and GSE37745 samples showed that there was a more consistent distribution between the different data sets (supplemental Fig. S3). However, no significant difference (supplemental Fig. S4) was observed between the TNM, stage, age, and smoking groups and TMECs in the TCGA data set, indicating that TME molecular subtypes and clinical feature groupings have absolute independency (GSE37745 data set has no clinical information, such as TNM).
Figure 3.
(A) Heat map of scores of 22 immune cells in the TME. (B) The expression of 22 immune cells in four TME clusters. The upper and lower ends of the boxes represent interquartile range of values. The lines in the boxes represent median value, and black dots show outliers.
Figure 4.
KM curve of TMEC OS prognosis (log rank p < 0.01).
Relationship Between TME Score and Clinical Features
Using clinical information such as TNM, stage, age, and smoking from the TCGA data, we compared the relationship between the scores of 22 immune cells and these clinical features. The scores of the 22 immune cells in different staging samples are shown in supplemental Figure S5.
Construction and Functional Analysis of the TME Signature
Identification of DEGs in the TME Cluster
Considering that TCGA and GSE37745 are transcriptome data of two different platforms, in order to study the differences in gene expression patterns between different TMECs, we selected TCGA data for TMEC differential expression analysis.
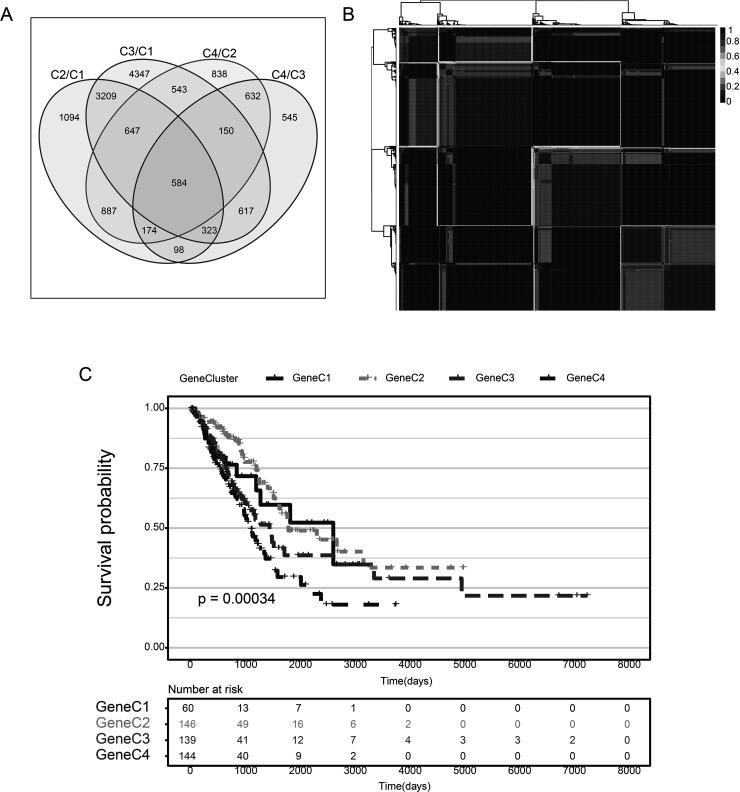
First, we used the DESeq2 tool to enrich for DEGs between the TMEC1/TMEC4 group with a relatively good prognosis and the TMEC2/TMEC3 group with a relatively poor prognosis; these DEGs may be one of the reasons for the difference in prognosis. A total of 584 shared DEGs of TMEC1/TMEC2, TMEC1/TMEC3, TMEC4/TMEC2, and TMEC4/TMEC3 were selected for subsequent analysis (Fig. 5A). The similarity distance method was applied to compare the similarity between the grouped samples (supplemental Fig. S6). The volcano diagram of the DEGs between groups is shown in supplemental Figure S7. The DEGs are elucidated in supplemental Tables S5–S8.
Figure 5.
(A) Venn diagram of differentially expressed genes in TMEC. (B) Consistency matrix heat map of NMF algorithm. (C) KM curve of TMEC OS prognosis (log rank p < 0.001).
Construction of the LUAD Gene Cluster by Differential Expression Genes
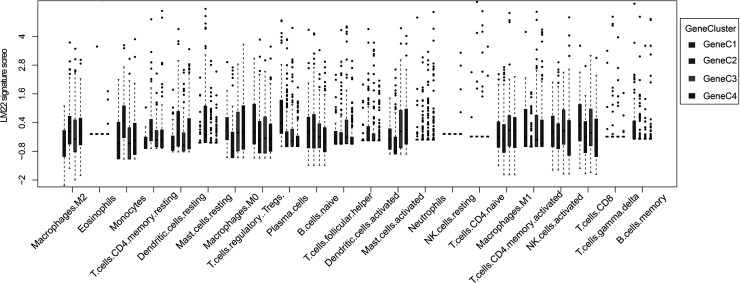
Based on 584 common DEGs, we used nonnegative matrix factorization (NMF) to conduct unsupervised clustering of the TCGA samples. The NMF method selects the standard “brunet” and performs 50 iterations. Number of clusters k was set to 2–10 and used the R package NMF to determine the average outline width of the ordinary member matrix, with a minimum number of members of each subclass set to 10. The optimal clustering number is determined based on the indexes of cophenetic, dispersion, and silhouette. The optimal clustering number was selected as 4 (Fig. 5B, supplemental Figs. S8 and S9), which is defined as GeneC1–GeneC4. The OS prognostic analysis shows that there are also significant differences between GeneCs (Fig. 5C). In comparing the scores of the 22 immune cells in GeneC, it was found that there is a more complex relationship between prognosis and the corresponding TME score that exists. For example, the score of GeneC4 with the worst prognosis regarding M0 macrophages is significantly higher than that of other GeneCs (Fig. 6).
Figure 6.
Score box plot of 22 immune cells in four GeneC clusters. The upper and lower ends of the boxes represent interquartile range of values. The lines in the boxes represent median value, and black dots show outliers.
Construction of a Prognostic Risk Model Based on the TME
Calculation of TME Score
In order to further identify the 584 DEGs shared in TMEC (dimension reduction), R package randomForest algorithm was used to evaluate the importance of these 584 DEGs. First, we set the number of random variables (mtry parameters) for each segmentation as 1–583 and ntree = 500, and chose the mtry value with the lowest error rate as the optimal mtry value of the random forest algorithm. Then choose ntree = 100 (supplemental Fig. S10A) according to the plot of random forest, and finally, the top 100 DEGs according to importance ranking were selected (supplemental Fig. S10B and C), and the TCGA cohort was performed to validate the differential expression of these genes. We selected the top five genes based on log FC, namely, SPP1, UBE2T, BIRC5, GJB2, and SLC2A1, for experimental validation. The WB and PCR results show that these five genes are highly expressed in cancer tissues, consistent with our data analysis (supplemental Fig. S11, Table S9).
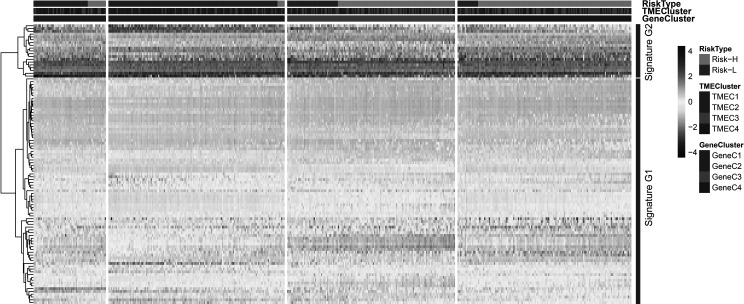
According to the TPM expression volume of the top 100 genes, a hierarchical clustering algorithm was used to classify them into a high expression group and a low expression group, which are defined as signature G1 and signature G2, respectively. G1 is the low expression group, which includes 81 genes, while G2 is the high expression group with 19 genes (Fig. 7). PCA analysis of signatures G1 and G2 was carried out by using the R psych package. For each gene signature, 100 iterations were performed to obtain the optimal number of PCs. Then the respective PC scores were calculated, and the PC1 scores of G1 and G2 were selected as the final scores. The prognosis risk model of G1 and G2 was established using the multivariate Cox regression analysis method. The TME score is calculated as
where β represents the multivariate regression coefficient of each signature G. PC1 represents the PC1 score of each signature G.
Figure 7.
Unsupervised clustering heat map of 100 gene expression selected by the random forest algorithm. The risk type, TME cluster, and GeneC cluster were used as patient annotations.
Gene Ontology (GO) and Kyoto Encyclopedia of Genes and Genomes (KEGG) enrichment analysis of signature G1 and signature G2 shows that G1 is mainly involved in cell proliferation and signal regulation. G2 is mainly related to the response of cells to wounding and metabolism (the corresponding G2 signature gene also shows significantly high expression) (supplemental Fig. S12, Tables S10 and S11).
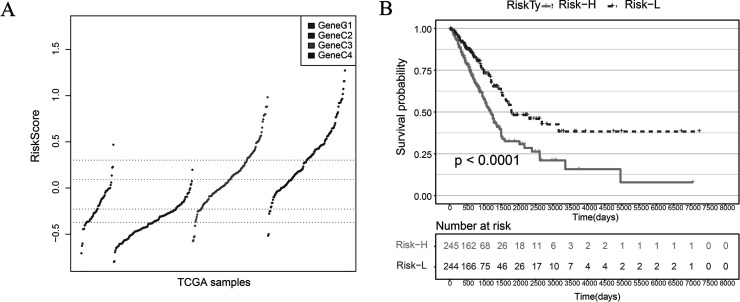
Comparing the TME score of GeneC, we found that the scores of GeneC3 and GeneC4 with the worst prognosis are significantly higher than that compared to GeneC1 and GeneC2 with the best prognosis (Fig. 8A). The median value of the TME score is taken to divide the samples into TME score high and TME score low. The samples are divided into two categories: Risk-H and Risk-L. There was a significant difference in OS prognosis between the Risk-H group and the Risk-L group (log-rank p < 0.001) (Fig. 8B).
Figure 8.
(A) TME score distribution of GeneC. (B) KM curve of OS prognosis in Risk-H and Risk-L samples (log rank p < 0.001).
Relationship Between TME Score and Clinical Features
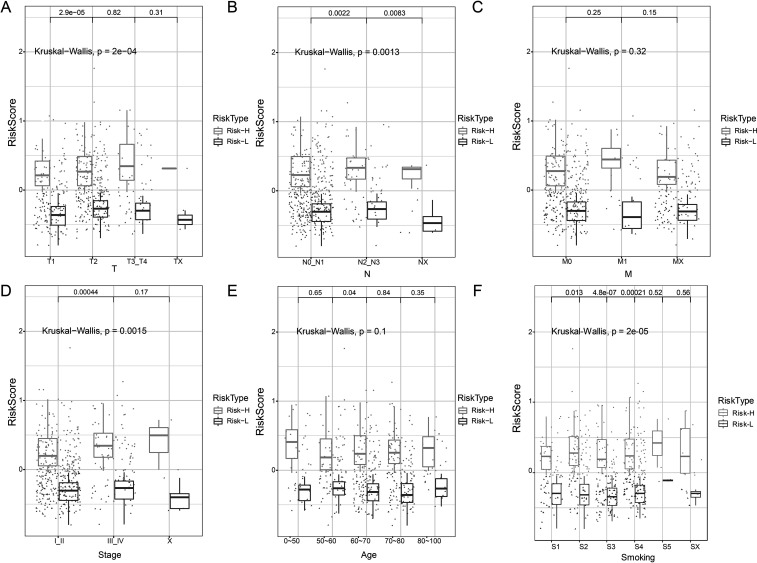
The TCGA data set provides information on TNM, stage, age, and smoking. Relationship between TME score and these clinical features was evaluated. The results showed significant differences in the TME score of TN staging, stage, and smoking. However, no significant differences were observed in M and age (Fig. 9).
Figure 9.
(A) Relationship between T staging and TME score. (B) Relationship between N staging and TME score. (C) Relationship between M staging and TME score. (D) Relationship between stage and TME score. (E) Relationship between age and TME score. (F) Relationship between smoking and TME score. Kruskal–Wallis p < 0.05.
Genomic Characteristics of LUAD Subtypes
Relationship Between TME Score and Immune Gene Expression
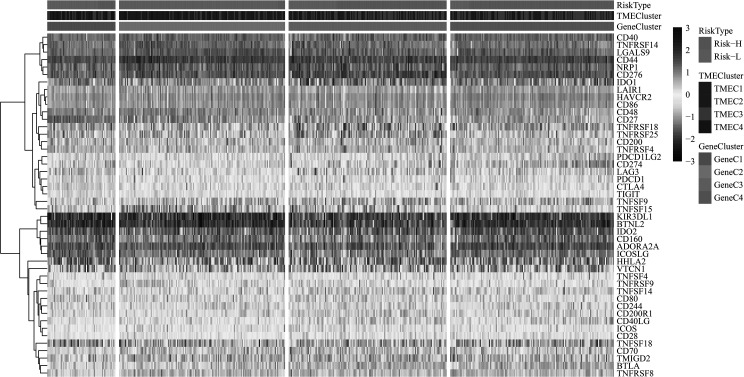
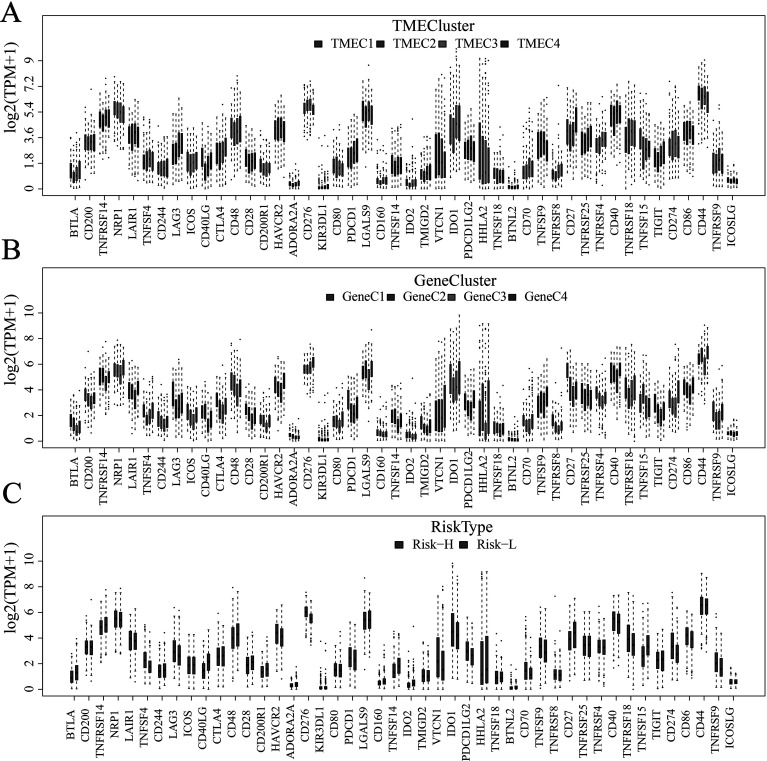
In order to study the relationship among various TME scores and immune status, we compared the distribution of four genes—IFNG, PDCD1 [programmed death 1 (PD-1)], CD274 [programmed cell death-ligand 1 (PD-L1)], and PDCD1LG2 (PD-L2)—on TMEC, GeneC, and TME scores (Fig. 10). The results revealed that the expression of PD-L1 and TNFSF9 in TMEC2/TMEC3, GeneC4, and Risk-H samples with the worst prognosis is significantly higher than that in the subtypes with the best prognosis (Fig. 11A–C). It is speculated that these patients with poor prognosis may be associated with the immunosuppression of T cells and B cells, which also indicates the high risk of patients with a high expression of PD-L1.
Figure 10.
Unsupervised clustering of immune-activated gene expression in LUAD cohort. The risk type, TME cluster, and GeneC cluster were used as patient annotations.
Figure 11.
(A) Relationship between the expression level of immune-activated genes and TMEC. (B) Relationship between the expression level of immune-activated genes and GeneC. (C) Relationship between the expression level of immune-activated genes and TME score. The upper and lower ends of the boxes represent interquartile range of values. The lines in the boxes represent median value, and black dots show outliers.
Relationship Between TME Score and Tumor Genome Mutation
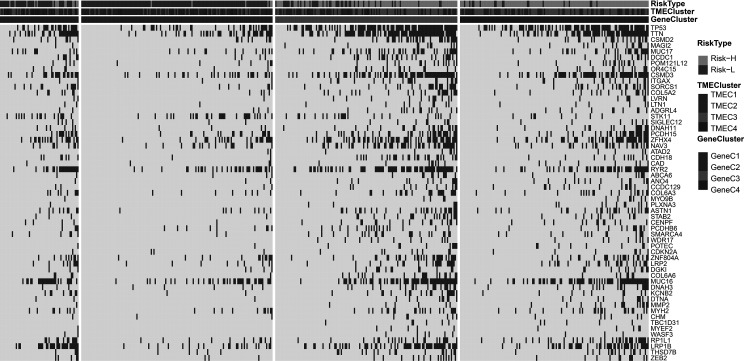
As TME score patients are assigned to the Risk-H and Risk-L groups, we compared the relationship between the TME score and genomic mutation and identified a group of relevant genes associated with TME score. Fisher’s test was applied to compare the mutation frequency between the Risk-H and Risk-L groups (excluding intron and silent mutations). A total of 57 genes (Fig. 12, supplemental Table S12) were obtained when p < 0.001 was specified. The results show that the mutation frequency of the TP53 gene in the Risk-H group is significantly higher than that in the Risk-L group. Besides, TTN and CSMD2 genes also showed a similar trend, which may indicate that these genes have a vital association with the TME of LUAD.
Figure 12.
The relationship between TME score and the characteristics of genome mutation. The risk type, TME cluster, and GeneC cluster were used as patient annotations.
DISCUSSION
In this study, RNA-Seq data and clinical information from 629 LUAD samples based on the TCGA database and GEO database were first obtained. LUAD samples were classified in two ways. First, four molecular subtypes were identified according to the correlation clustering between gene expression and 22 immune cells. Among them, TMEC2 and TMEC3 subtypes have a poor prognosis, with higher scores of M0 macrophages and activated mast cells. Second, a total of 584 DEGs from four subtypes were analyzed by cluster analysis. Among the four subtypes, the worst prognosis was found as GeneC4, which also has a higher M0 macrophage score. Some similarities between the two classification results were also found. High M0 macrophage scores are found in all subtypes with poor prognosis. It is speculated that the M0 macrophage score may be a potential indicator to evaluate prognosis.
The risk model based on the TME score can divide LUAD into a high-risk group and a low-risk group. In the present study, it is found that the scores of GeneC3 and GeneC4 with the worst prognosis were significantly higher than those of GeneC1 as well as GeneC2 with the best prognosis. There was a significant difference in the OS prognosis between the Risk-H group and the Risk-L group based on TME score, indicating that the model has good prediction ability. Compared with the three classification methods, the expression of PD-1 and PD-L1 in TMEC2/TMEC3, GeneC4, and Risk-H samples with the worst prognosis was significantly higher than that in the subtypes with the best prognosis, suggesting that the high expression of PD-1 and PD-L1 may indicate a high risk in patients. The combination of PD-1 on the surface of T cells and PD-L1 on the surface of tumor cells can inhibit the activity of T cells, allowing tumor cells to escape the attack of T lymphocytes26. Hence, it is speculated that these patients with poor prognosis may be associated with the immune suppression of T cells. Previous studies have established that the expression of PD-1/PD-L1 in gastric cancer, ovarian cancer, and other cancer samples is significantly higher than that in healthy tissues27,28. Immunosuppressive therapy represented by PD-1/PD-L1 monoclonal antibodies has attracted much attention, which has become a hotspot in tumor immunotherapy recently29. By blocking the PD-1/PD-L1 signaling pathway, the immune system of the body is restored to treat a variety of tumors. Monoclonal antibodies for blocking the PD-1/PD-L1 pathway have entered the clinical stage, which has been proven to be effective in the treatment of multiple malignant tumors, such as lung cancer, gastric cancer, and breast cancer30. However, the correlation between expression level of PD-1/PD-L1 and the clinical pathological characteristics of cancer patients is still controversial.
Presently, numerous scholars have conducted research work in this field, achieving meaningful results. For example, van’t Veer et al.31 analyzed the gene expression profile of 117 young patients with primary breast cancer and obtained a molecular signature with poor prognosis of breast cancer. A comprehensive analysis of this signature with the clinical prognostic characteristics of patients can successfully predict the risk of distant organ metastasis in patients without local lymph node metastasis in the short term. Various meaningful evidence has been obtained by combining gene expression profiles with the clinical characteristics of patients with gastric cancer, breast cancer, and other different types of tumors32,33. Similarly, we evaluated the correlation between TME score and clinical features to assess the prognostic risk of patients accurately. There were also significant differences in TME scores between T and N staging, stage, and smoking, indicating a precise correlation between the grouping results of the TME score and clinical features.
The relationship between TME score and genomic mutation was compared and identified the key genes associated with TME scores, such as TP53 and CSMD2. TP53 is the most common tumor suppressor gene. TP53 protein is mainly involved in regulating the cell cycle, promoting apoptosis and DNA damage repair34. Mutation or deletion of TP53 leads to cell cycle disorder and apoptosis suppression. More importantly, it affects the damage repair function of DNA, resulting in genomic instability35. All of these factors may increase the load of tumor mutations.
Additionally, TP53 mutant tumors have characteristic of significantly increased PD-L1 expression36. The mutation frequency of the TP53 gene in the Risk-H group was significantly higher than that in the Risk-L group, which may be one of the reasons for the high expression of PD-L1 in the Risk-H group. CSMD2 is a high-frequency mutant gene37. Studies have identified that CSMD2 may be a potential biomarker for patients with colon cancer38. The existence of these high-frequency mutation genes may be related to the poor prognosis of the Risk-H group.
The present research work also has some limitations. The current sequencing cost is still insufficient to cope with large-scale multisampling of whole-genome sequencing. Coupled with the constraints of social ethics and other factors, the number of available cancer samples is still relatively limited. With the continuous development of bioinformatics technology, expanding the sample size will help to improve the completeness and representativeness of our data and enhance the reliability of the model. Also, this research requires further verification of biological experiments. In a later study, we will verify the key genes contained in the preliminarily identified molecular signatures of lung cancer, study their molecular function, and analyze their role in the occurrence and development of LUAD. The correlation between the expression at the protein level and the clinical characteristics of patients will also be analyzed to verify the reliability of molecular signatures. The immune-related molecular signature of LUAD will finally be determined to provide effective valid criterion for the prognosis and diagnosis of LUAD.
In conclusion, this study analyzed 22 immune cell components in the LUAD TME, constructed LUAD molecular subtypes based on the TME score, and further evaluated the relationship between molecular subtypes and prognosis and clinical characteristics. The TME risk score model was constructed by using the DEGs of LUAD subtypes, which can better evaluate the prognosis of LUAD samples. By further comparing the relationship between the TME score and genomic mutation, a group of genes associated with the TME was found. In summary, the comprehensive analysis of the TME characteristics of LUAD may help to explain the response of LUAD to immunotherapy and provide a new strategy for LUAD immunotherapy.
ACKNOWLEDGMENTS
This study is supported by grants from the 2017 National Natural Science Foundation of China (project approval: 81774327), 2017 Guangxi Scientific Research and Technology Development Plan (key research and development plan) (project contract: Guike AB17195071), and Special Funding for Guangxi Special Experts and Funding for “139” program of Guangxi medical high level leading talents training. Author contributions: Bo Ling (conceptualization, data curation, and formal analysis); Zuliang Huang and Suoyi Huang (methodology and supervision); Bo Ling, Genliang Li, and Li Qian (writing of original draft); and Qianli Tang (review and editing). All authors had final approval of the submitted versions. The data sets used and/or analyzed during the current study are available from the corresponding author on reasonable request. Supplemental information for this article is available at https://github.com/lingbo268/lingbobioinformatics.
Footnotes
The authors declare no conflicts of interest.
REFERENCES
- 1. Kessenbrock K, Plaks V, Werb Z. Matrix metalloproteinases: Regulators of the tumor microenvironment. Cell 2010;141(1):52–67. [DOI] [PMC free article] [PubMed] [Google Scholar]
- 2. Hanahan D, Weinberg RA. Hallmarks of cancer: The next generation. Cell 2011;144(5):646–74. [DOI] [PubMed] [Google Scholar]
- 3. Gentles AJ, Newman AM, Liu CL, Bratman SV, Feng W, Kim D, Nair VS, Xu Y, Khuong A, Hoang CD, Diehn M, West RB, Plevritis SK, Alizadeh AA. The prognostic landscape of genes and infiltrating immune cells across human cancers. Nat Med. 2015;21(8):938–45. [DOI] [PMC free article] [PubMed] [Google Scholar]
- 4. Turley SJ, Cremasco V, Astarita JL. Immunological hallmarks of stromal cells in the tumour microenvironment. Nat Rev Immunol. 2015;15(11):669–82. [DOI] [PubMed] [Google Scholar]
- 5. Zhan HX, Zhou B, Cheng YG, Xu JW, Wang L, Zhang GY, Hu SY. Crosstalk between stromal cells and cancer cells in pancreatic cancer: New insights into stromal biology. Cancer Lett. 2017;392:83–93. [DOI] [PubMed] [Google Scholar]
- 6. Zou W, Chen L. Inhibitory B7-family molecules in the tumour microenvironment. Nat Rev Immunol. 2008;8(6):467–77. [DOI] [PubMed] [Google Scholar]
- 7. Fridman WH, Zitvogel L, Sautès-Fridman C, Kroemer G. The immune contexture in cancer prognosis and treatment. Nat Rev Clin Oncol. 2017;14(12):717–34. [DOI] [PubMed] [Google Scholar]
- 8. Mantovani A, Marchesi F, Malesci A, Laghi L, Allavena P. Tumour-associated macrophages as treatment targets in oncology. Nat Rev Clin Oncol. 2017;14(7):399–416. [DOI] [PMC free article] [PubMed] [Google Scholar]
- 9. Kalluri R. The biology and function of fibroblasts in cancer. Nat Rev Cancer 2016;16(9):582–98. [DOI] [PubMed] [Google Scholar]
- 10. Gajewski TF, Schreiber H, Fu YX. Innate and adaptive immune cells in the tumor microenvironment. Nat Immunol. 2013;14(10):1014–22. [DOI] [PMC free article] [PubMed] [Google Scholar]
- 11. Whiteside TL. The tumor microenvironment and its role in promoting tumor growth. Oncogene 2008;27(45):5904–12. [DOI] [PMC free article] [PubMed] [Google Scholar]
- 12. Lou Y, Diao L, Cuentas ER, Denning WL, Chen L, Fan YH, Byers LA, Wang J, Papadimitrakopoulou VA, Behrens C, Rodriguez JC, Hwu P, Wistuba II, Heymach JV, Gibbons DL. Epithelial–mesenchymal transition is associated with a distinct tumor microenvironment including elevation of inflammatory signals and multiple immune checkpoints in lung adenocarcinoma. Clin Cancer Res. 2016;22(14):3630–42. [DOI] [PMC free article] [PubMed] [Google Scholar]
- 13. Landi MT, Dracheva T, Rotunno M, Figueroa JD, Liu H, Dasgupta A, Mann FE, Fukuoka J, Hames M, Bergen AW, Murphy SE, Yang P, Pesatori AC, Consonni D, Bertazzi PA, Wacholder S, Shih JH, Caporaso NE, Jen J. Gene expression signature of cigarette smoking and its role in lung adenocarcinoma development and survival. PLoS One 2008;3(2):e1651. [DOI] [PMC free article] [PubMed] [Google Scholar]
- 14. Tomida S, Takeuchi T, Shimada Y, Arima C, Matsuo K, Mitsudomi T, Yatabe Y, Takahashi T. Relapse-related molecular signature in lung adenocarcinomas identifies patients with dismal prognosis. J Clin Oncol. 2009;27(17):2793–9. [DOI] [PubMed] [Google Scholar]
- 15. Volinia S, Calin GA, Liu CG, Ambs S, Cimmino A, Petrocca F, Visone R, Iorio M, Roldo C, Ferracin M, Prueitt RL, Yanaihara N, Lanza G, Scarpa A, Vecchione A, Negrini M, Harris CC, Croce CM. A microRNA expression signature of human solid tumors defines cancer gene targets. Proc Natl Acad Sci USA 2006;103(7):2257–61. [DOI] [PMC free article] [PubMed] [Google Scholar]
- 16. Wang Y, Klijn JG, Zhang Y, Sieuwerts AM, Look MP, Yang F, Talantov D, Timmermans M, Meijer-van Gelder ME, Yu J, Jatkoe T, Berns EM, Atkins D, Foekens JA. Gene-expression profiles to predict distant metastasis of lymph-node-negative primary breast cancer. Lancet 2005;365(9460):671–9. [DOI] [PubMed] [Google Scholar]
- 17. Collisson EA, Sadanandam A, Olson P, Gibb WJ, Truitt M, Gu S, Cooc J, Weinkle J, Kim GE, Jakkula L, Feiler HS, Ko AH, Olshen AB, Danenberg KL, Tempero MA, Spellman PT, Hanahan D, Gray JW. Subtypes of pancreatic ductal adenocarcinoma and their differing responses to therapy. Nat Med. 2011;17(4):500–3. [DOI] [PMC free article] [PubMed] [Google Scholar]
- 18. Chang HY, Nuyten DS, Sneddon JB, Hastie T, Tibshirani R, Sørlie T, Dai H, He YD, van’t Veer LJ, Bartelink H, van de Rijn M, Brown PO, van de Vijver MJ. Robustness, scalability, and integration of a wound-response gene expression signature in predicting breast cancer survival. Proc Natl Acad Sci USA 2005;102(10):3738–43. [DOI] [PMC free article] [PubMed] [Google Scholar]
- 19. Wirapati P, Sotiriou C, Kunkel S, Farmer P, Pradervand S, Haibe-Kains B, Desmedt C, Ignatiadis M, Sengstag T, Schütz F, Goldstein DR, Piccart M, Delorenzi M. Meta-analysis of gene expression profiles in breast cancer: Toward a unified understanding of breast cancer subtyping and prognosis signatures. Breast Cancer Res. 2008;10(4):R65. [DOI] [PMC free article] [PubMed] [Google Scholar]
- 20. Brenton JD, Carey LA, Ahmed AA, Caldas C. Molecular classification and molecular forecasting of breast cancer: Ready for clinical application? J Clin Oncol. 2005;23(29):7350–60. [DOI] [PubMed] [Google Scholar]
- 21. Newman AM, Liu CL, Green MR, Gentles AJ, Feng W, Xu Y, Hoang CD, Diehn M, Alizadeh AA. Robust enumeration of cell subsets from tissue expression profiles. Nat Methods 2015;12(5):453–7. [DOI] [PMC free article] [PubMed] [Google Scholar]
- 22. Boillaud E, Molina G. Are judgments a form of data clustering? Reexamining contrast effects with the k-means algorithm. J Exp Psychol Hum Percept Perform. 2015;41(2):415–30. [DOI] [PubMed] [Google Scholar]
- 23. Welinder C, Ekblad L. Coomassie staining as loading control in Western blot analysis. J Proteome Res. 2011;10(3):1416–9. [DOI] [PubMed] [Google Scholar]
- 24. Ghasemi A, Zahediasl S. Normality tests for statistical analysis: A guide for non-statisticians. Int J Endocrinol Metab. 2012;10(2):486–9. [DOI] [PMC free article] [PubMed] [Google Scholar]
- 25. Hazra A, Gogtay N. Biostatistics series module 3: Comparing groups: Numerical variables. Indian J Dermatol. 2016;61(3):251–60. [DOI] [PMC free article] [PubMed] [Google Scholar]
- 26. Topalian SL, Hodi FS, Brahmer JR, Gettinger SN, Smith DC, McDermott DF, Powderly JD, Carvajal RD, Sosman JA, Atkins MB, Leming PD, Spigel DR, Antonia SJ, Horn L, Drake CG, Pardoll DM, Chen L, Sharfman WH, Anders RA, Taube JM, McMiller TL, Xu H, Korman AJ, Jure-Kunkel M, Agrawal S, McDonald D, Kollia GD, Gupta A, Wigginton JM, Sznol M. Safety, activity, and immune correlates of anti-PD-1 antibody in cancer. N Engl J Med. 2012;366(26):2443–54. [DOI] [PMC free article] [PubMed] [Google Scholar]
- 27. Hamanishi J, Mandai M, Matsumura N, Abiko K, Baba T, Konishi I. PD-1/PD-L1 blockade in cancer treatment: Perspectives and issues. Int J Clin Oncol. 2016;21(3):462–73. [DOI] [PMC free article] [PubMed] [Google Scholar]
- 28. Wang X, Teng F, Kong L, Yu J. PD-L1 expression in human cancers and its association with clinical outcomes. Onco Targets Ther. 2016;9:5023–39. [DOI] [PMC free article] [PubMed] [Google Scholar]
- 29. Naidoo J, Page DB, Li BT, Connell LC, Schindler K, Lacouture ME, Postow MA, Wolchok JD. Toxicities of the anti-PD-1 and anti-PD-L1 immune checkpoint antibodies [published correction appears in Ann Oncol. 2016 Jul;27(7):1362]. Ann Oncol. 2015;26(12):2375–91. [DOI] [PMC free article] [PubMed] [Google Scholar]
- 30. Maleki Vareki S, Garrigós C, Duran I. Biomarkers of response to PD-1/PD-L1 inhibition. Crit Rev Oncol Hematol. 2017;116:116–24. [DOI] [PubMed] [Google Scholar]
- 31. van’t Veer LJ, Dai H, van de Vijver MJ, He YD, Hart AA, Mao M, Peterse HL, van der Kooy K, Marton MJ, Witteveen AT, Schreiber GJ, Kerkhoven RM, Roberts C, Linsley PS, Bernards R, Friend SH. Gene expression profiling predicts clinical outcome of breast cancer. Nature 2002;415(6871):530–6. [DOI] [PubMed] [Google Scholar]
- 32. Cristescu R, Lee J, Nebozhyn M, Kim KM, Ting JC, Wong SS, Liu J, Yue YG, Wang J, Yu K, Ye XS, Do IG, Liu S, Gong L, Fu J, Jin JG, Choi MG, Sohn TS, Lee JH, Bae JM, Kim ST, Park SH, Sohn I, Jung SH, Tan P, Chen R, Hardwick J, Kang WK, Ayers M, Hongyue D, Reinhard C, Loboda A, Kim S, Aggarwal A. Molecular analysis of gastric cancer identifies subtypes associated with distinct clinical outcomes. Nat Med. 2015;21(5):449–56. [DOI] [PubMed] [Google Scholar]
- 33. Sotiriou C, Wirapati P, Loi S, Harris A, Fox S, Smeds J, Nordgren H, Farmer P, Praz V, Haibe-Kains B, Desmedt C, Larsimont D, Cardoso F, Peterse H, Nuyten D, Buyse M, Van de Vijver MJ, Bergh J, Piccart M, Delorenzi M. Gene expression profiling in breast cancer: Understanding the molecular basis of histologic grade to improve prognosis. J Natl Cancer Inst. 2006;98(4):262–72. [DOI] [PubMed] [Google Scholar]
- 34. Silwal-Pandit L, Vollan HK, Chin SF, Rueda OM, McKinney S, Osako T, Quigley DA, Kristensen VN, Aparicio S, Børresen-Dale AL, Caldas C, Langerød A. TP53 mutation spectrum in breast cancer is subtype specific and has distinct prognostic relevance [published correction appears in Clin Cancer Res. 2015;21(6):1502]. Clin Cancer Res. 2014;20(13):3569–80. [DOI] [PubMed] [Google Scholar]
- 35. Soussi T, Béroud C. Assessing TP53 status in human tumours to evaluate clinical outcome. Nat Rev Cancer 2001;1(3):233–40. [DOI] [PubMed] [Google Scholar]
- 36. Cortez MA, Ivan C, Valdecanas D, Wang X, Peltier HJ, Ye Y, Araujo L, Carbone DP, Shilo K, Giri DK, Kelnar K, Martin D, Komaki R, Gomez DR, Krishnan S, Calin GA, Bader AG, Welsh JW. PDL1 Regulation by p53 via miR-34. J Natl Cancer Inst. 2015;108(1):djv303. [DOI] [PMC free article] [PubMed] [Google Scholar]
- 37. Schulze K, Imbeaud S, Letouzé E, Alexandrov LB, Calderaro J, Rebouissou S, Couchy G, Meiller C, Shinde J, Soysouvanh F, Calatayud AL, Pinyol R, Pelletier L, Balabaud C, Laurent A, Blanc JF, Mazzaferro V, Calvo F, Villanueva A, Nault JC, Bioulac-Sage P, Stratton MR, Llovet JM, Zucman-Rossi J. Exome sequencing of hepatocellular carcinomas identifies new mutational signatures and potential therapeutic targets. Nat Genet. 2015;47(5):505–11. [DOI] [PMC free article] [PubMed] [Google Scholar]
- 38. Zhang R, Song C. Loss of CSMD1 or 2 may contribute to the poor prognosis of colorectal cancer patients. Tumour Biol. 2014;35(5):4419–23. [DOI] [PubMed] [Google Scholar]


