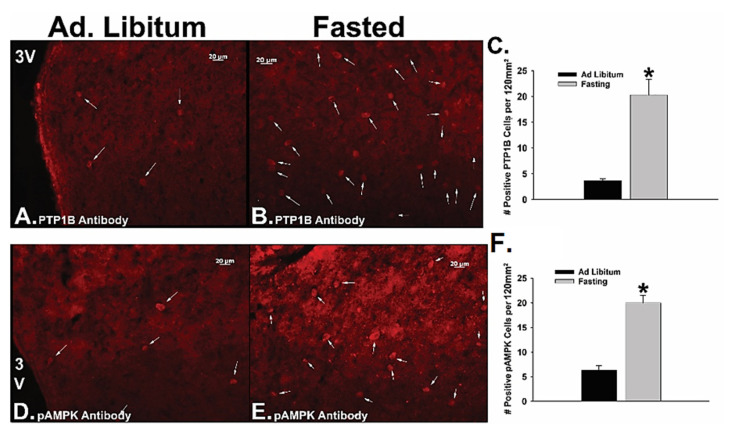
Figure 8.
Fasting augments the activity and expression of PTP1B and AMPK in the ARC. The four 20× images depict the PTP1B (A,B; 1:100) and pAMPK (D,E; 1:100) immunoreactivity under ad libitum-fed (A,D) and fasting (B,E) as visualized with AF546 (1:600). The composite data in the bar graphs summarize the fasting-induced increase in the number of PTP1B- (C) and pAMPK-immunoreactive (F) cells per capita in the ARC. Bars represent means and lines 1 SEM. * p < 0.05, relative to ad libitum-fed conditions, Student’s t-test.

