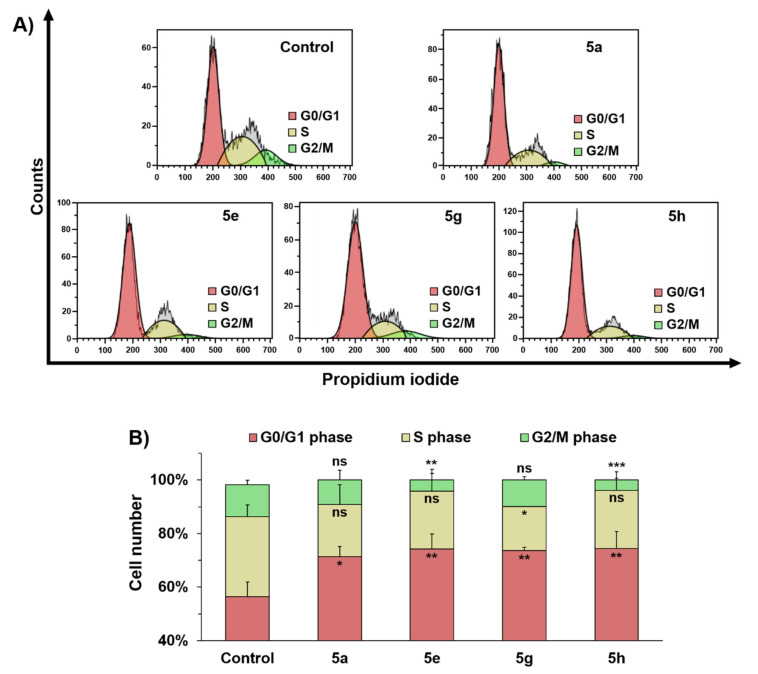
Figure 4.
Flow cytometry cell cycle analysis of MCF-7 cells exposed for 24 h to IC50 concentrations of 5a, 5e, 5g, and 5h and 0.5% DMSO vehicle (control). (A) Cell cycle histogram plots show a single representative experiment. (B) Cell cycle distribution of MCF-7 cells treated with IC50 concentrations of 5a, 5e, 5g, and 5h and 0.5% DMSO vehicle for 24 h. Data are presented as mean ± SD; n = 3. Statistical significances are referred to the DMSO control. Differences between groups were determined by analysis of variance (ANOVA), and Dunnett’s test was used for multiple comparisons with the control. * p < 0.05; ** p < 0.01; *** p < 0.0001.

