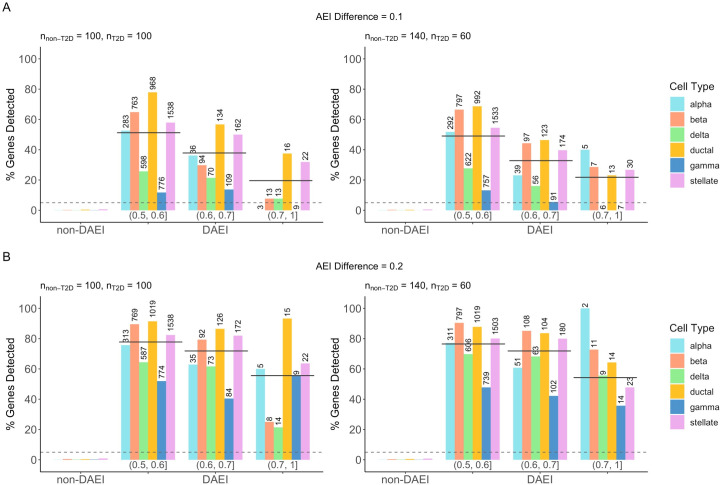
Fig 5. Benchmark evaluation for cell-type-specific differential AEI (DAEI) detection.
Using true cell type proportions, we evaluated the performance of BSCET as a function of sample size for healthy (i.e., non-T2D) and diseased (i.e., T2D) samples, and true cell-type-specific AEI difference between two-condition samples (0.1 (A) and 0.2 (B)). Type I error rate (non-DAEI) and power (DAEI) were evaluated at significance level α = 0.05 (dashed line), further separated by the cell type and level of AEI in the healthy samples. The number above each bar indicates the total number of SNPs with cell-type-specific DAEI within the category. The solid line indicates the overall power across all cell types.

