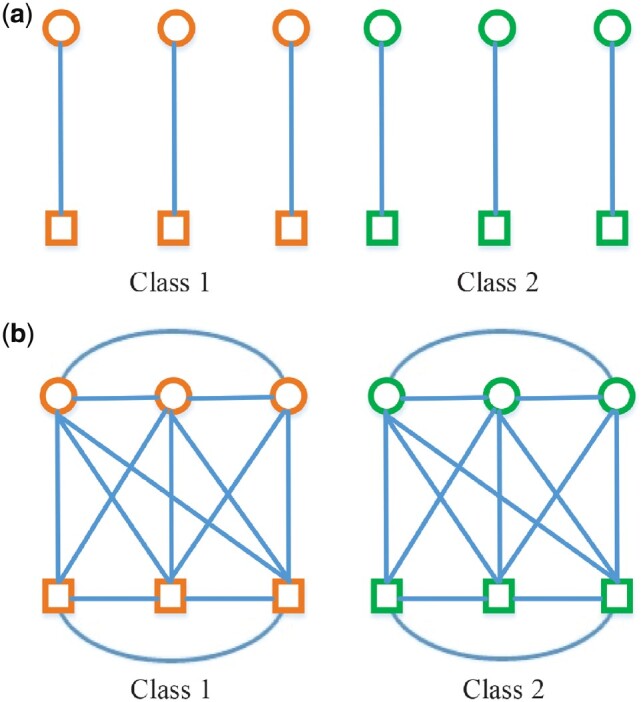
Fig. 3.

Illustrations on the relationships among modalities and subjects. (a) Traditional multi-modality method in identifying subjects for class 1 and class 2. (b) Proposed method in identifying subjects for class 1 and class 2. Circles and rectangles represent node features data from sMRI and edge features data from fMRI, respectively. Orange and green denote different classes
