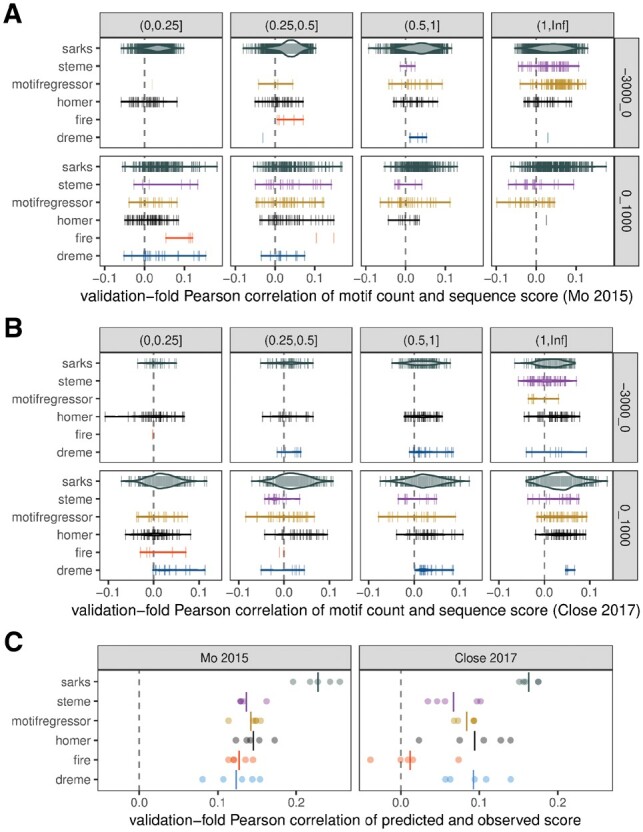
Fig. 3.

Benchmark comparisons of correlations between motif counts and gene specificity scores in held-out validation subsamples. (A) Each vertical line represents a motif identified by the indicated algorithm in one of the five cross-validation folds for the Mo (2015) dataset (Mo et al. 2015). The horizontal position of the line encodes the Pearson correlation coefficient of the motif count with the associated sequence score (calculated using only the genes in the held-out validation set for the cross-validation fold in which the motif was identified). The count for a given motif in sequence wb was assessed using fimo (Grant et al. 2011) for DREME, HOMER, MOTIF REGRESSOR and STEME—all of which represent motifs as position-weight matrices—and using a simple regular expression search for FIRE (which returns regular expression representations of motifs) and for SArKS k-mers. In all cases, motif counts were based on motif occurrences on either the forward or reverse strand. Row: sequence region for motif counts, either 3 kb upstream or 1 kb downstream of TSS; column: interval containing average number of occurrences of motif within sequence region across all analyzed genes. Widths of violins represent motif density and are scaled consistently across all panels. (B) Same as (A), except applied to Close (2017) dataset (Close et al. 2017). (C) Motif regression model predictions correlate with gene specificity scores in held-out cross-validation subsamples. Each of five cross-validation folds is plotted as separate point for each algorithm. Each regression model was built using feature vector constructed by concatenating counts of upstream motifs in upstream regions with counts of downstream motifs in downstream regions. Left panel: results of modeling applied to Mo (2015) dataset; right panel: same for Close (2017) dataset. Vertical lines indicate mean Pearson correlation across all folds
