Fig. 6.

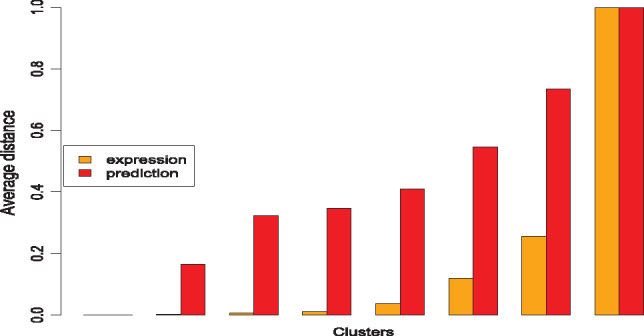
Comparison between the distribution of expression similarity and the distribution of similarity concerning predicted functions. The plot shows a clear positive correlation between the two distributions

Comparison between the distribution of expression similarity and the distribution of similarity concerning predicted functions. The plot shows a clear positive correlation between the two distributions