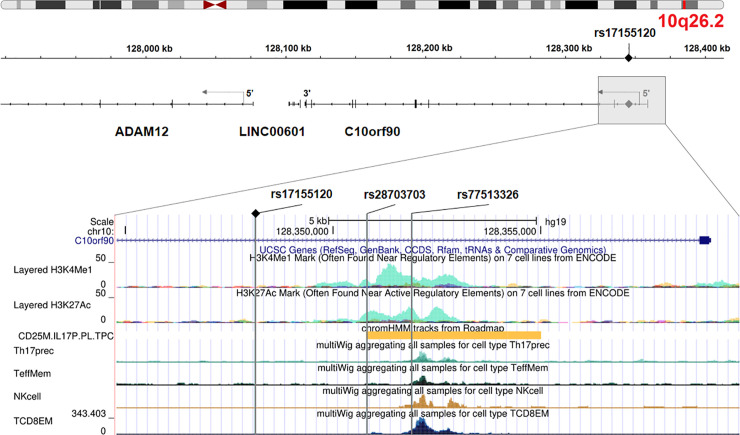
Fig 3. Genomic annotation of the locus on chromosome region 10q26.2.
The upper panel is adapted from Integrative Genomics Viewer (http://igv.org/app/) and the lower panel is adapted from UCSC Genome Browser (http://genome.ucsc.edu/). The 3 vertical grey lines represent the associated variants rs1715120, rs28703703 and rs77513326 (from left to right) that overlap regulatory regions. From top to bottom: H3K4me1 and H3K27ac histone marks from ENCODE, active enhancer in Th17 cells (chromHMM annotation from ROADMAP), chromatin accessibility as represented by ATAC peaks in Th17 cells, memory T cells, NK cells and CD8+ T cells [20].

