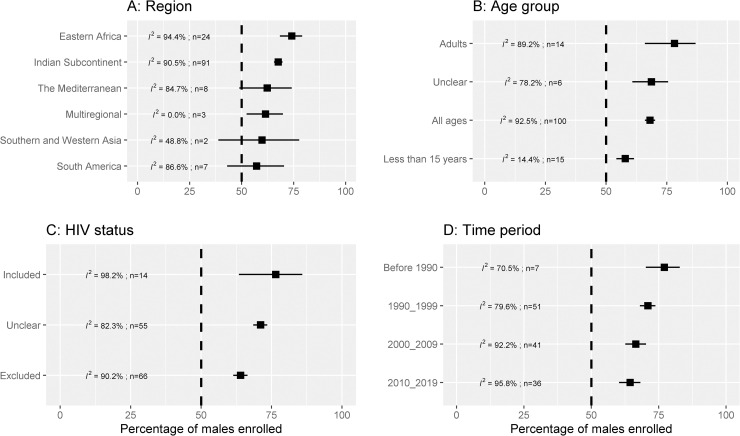
Fig 2. Percentage of males enrolled in VL clinical trials.
I2 is a measure of heterogeneity (larger values indicate more heterogeneity); n is the number of studies combined for generating the pooled estimate. The vertical dotted line represents no difference in the enrolled proportion of males and females. The error bars are 95% confidence interval obtained from random effects meta-analysis of proportions.

