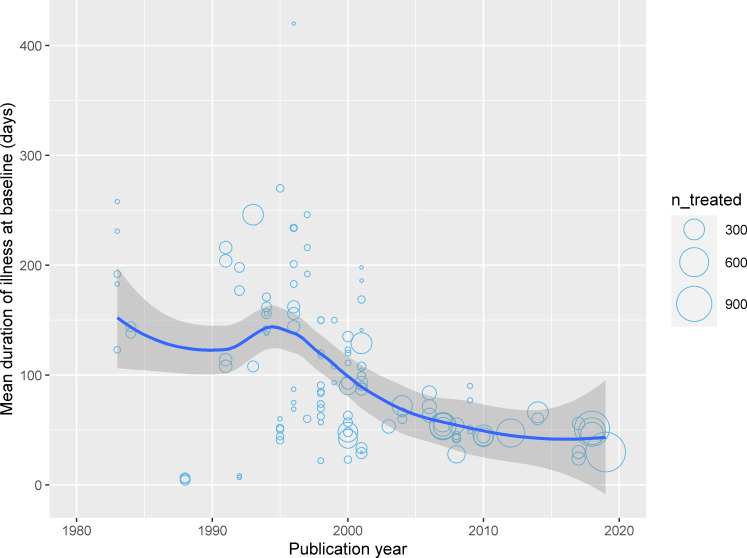
Fig 4. Mean duration of illness at presentation, days.
The trend line is a lowess smoother and the confidence band is associated 95% confidence interval. Data available from 59 studies (13,164 patients) from a total of 132 study arms. Each circle represents a study arm and the size of the bubble is proportional to the number of patients enrolled in the study arm. The duration of illness was reported as median in 8 study arms and as a mean in 128 study arms (see S1 Data).

