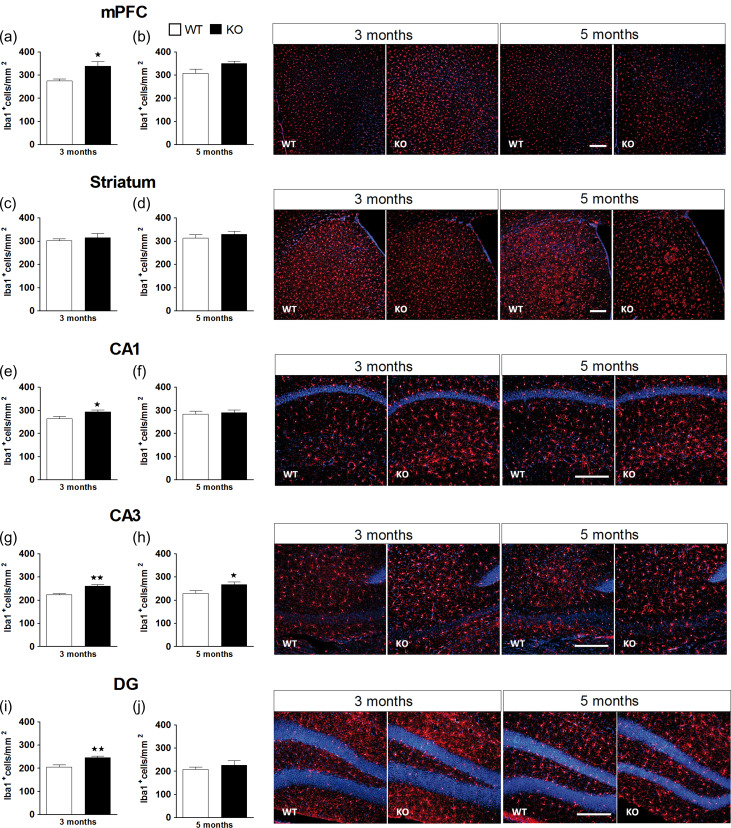
Figure 3.
Microglial expression in the medial prefrontal cortex (mPFC), the striatum and the hippocampus (HPC). Quantification of Iba1 immunofluorescence staining in the mPFC (a, b), the striatum (c, d), and the CA1 (e, f), the CA3 (g, h), and the dentate gyrus (i, j) of the HPC in WT (n = 6) and KO (n = 6) male mice at 3 and 5 months of age. The panels on the right show representative images of Iba1 positive cells (red) and DAPI counterstaining (blue). Scale bar = 200 μm. Images were taken at ×10 in the mPFC and striatum, and at ×20 in the HPC. The data are mean + SEM Iba1+ cells per mm2. *P < 0.05, **P < 0.01 versus WT group (separate one-way ANOVAs for 3 and 5 months). See Supplementary Table S5 for statistical values.

