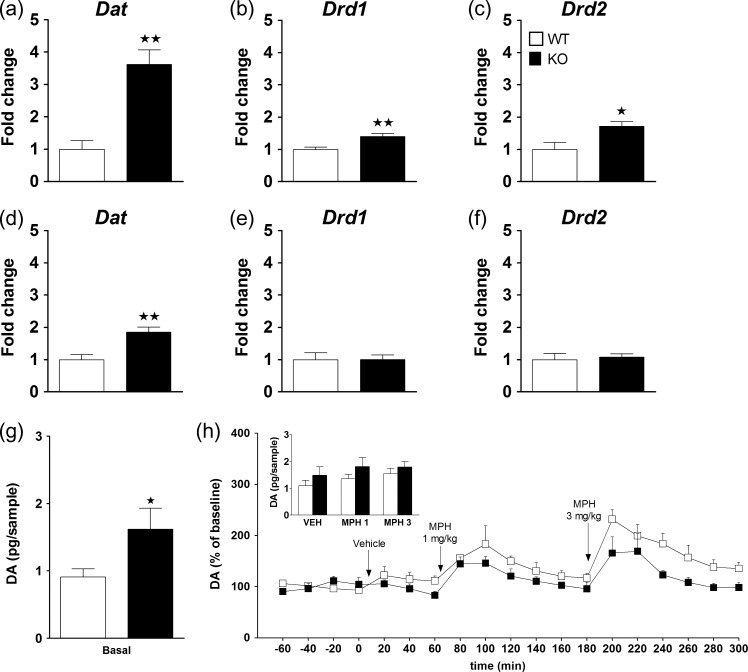
Figure 4.
Changes in the dopaminergic gene expression of KO mice in the medial prefrontal cortex (mPFC) and the hippocampus (HPC) and quantification of extracellular DA levels in mPFC. Real time qPCR was assessed in the mPFC for dopamine transporter (Dat) (a), dopamine receptor D1 (Drd1) (b) and dopamine receptor D2 (Drd2) (c), and in the HPC for Dat (d), Drd1 (e), and Drd2 (f) in WT (n = 7) and KO (n = 7) mice at 5 months of age. The Y-axis shows the mRNA expression as a fold change compared with the WT group. Values show the mean + SEM. *P < 0.05, **P < 0.01 versus WT group (one-way ANOVA). See Supplementary Table S5 for statistical values. The quantification of extracellular levels of dopamine (DA) in the mPFC in WT (n = 6) and KO (n = 6) mice revealed that basal extracellular levels of DA (pg/sample) are increased in KO with respect to WT mice (g) (*P < 0.05, one-way ANOVA). Percent of baseline levels of DA are shown for WT and KO mice challenged with an acute administration of vehicle and methylphenidate (MPH) at the doses of 1 and 3 mg/kg (black arrows) at different time points (h). The inset shows the mean extracellular levels of DA (pg/sample) following acute administration of MPH (1 and 3 mg/kg) or vehicle in WT (white bars) and KO (black bars).

