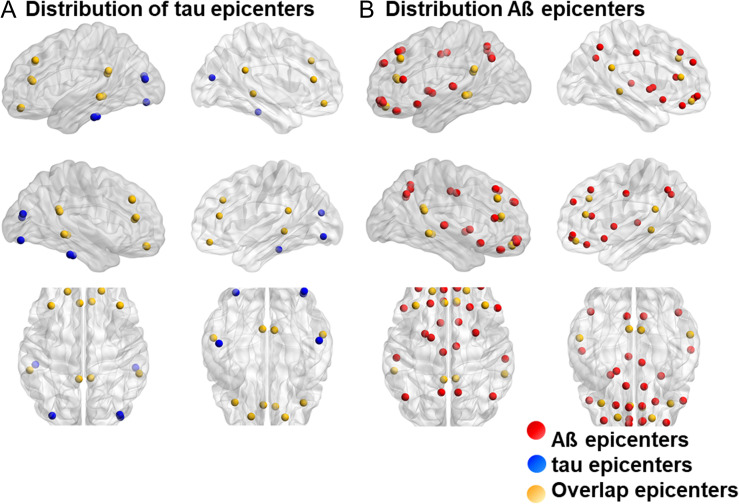
Figure 4.
Map of Aß and tau epicenters (best-fit epicenters of the transneuronal spread model). (A) Tau epicenters at a threshold of 0.6 (blue dots), (B) Aß epicenters at a threshold of 0.5 (red dots), and epicenters overlapping in both tau and Aß (yellow dots) are depicted in the map. Aβ, amyloid β.

