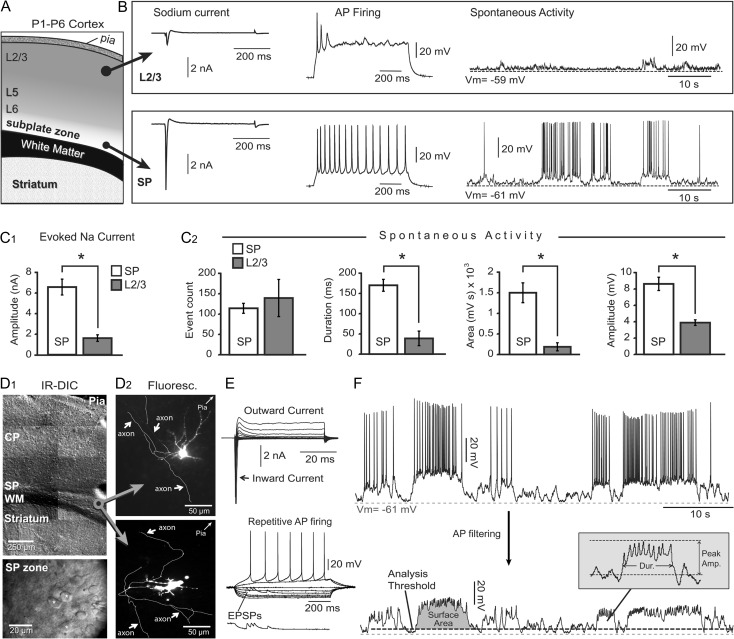
Figure 1.
Subplate neurons versus L2/3 neurons. (A) Schematic drawing of coronal section through neonatal mouse cortex. (B) Whole-cell measurements in L2/3 cells (top row) and SP cells (bottom row). (C1) Comparison of the peak sodium current in 2 layers. In this and all following figures asterisk indicates P < 0.05. (C2) Comparisons of the spontaneous electrical activity parameters in 2 layers. (D1) DIC images of P2 mouse cerebral cortex at 2 magnifications. CP = cortical plate; SP = subplate; WM = white matter. (D2) Alexa Fluor-filled SP neuron with axonal arborization (white arrows). (E) Upper: membrane currents in response to voltage commands from −70 to +20 mV. Lower: repetitive action potential firing upon direct current injection. (F) Upper: recording of spontaneous electrical activity in a mouse subplate neuron. Lower: same trace after low-pass filtering of action potentials. Surface area, duration and peak amplitude are marked on traces. Dashed gray line—resting potential. Dashed black line—event threshold.

