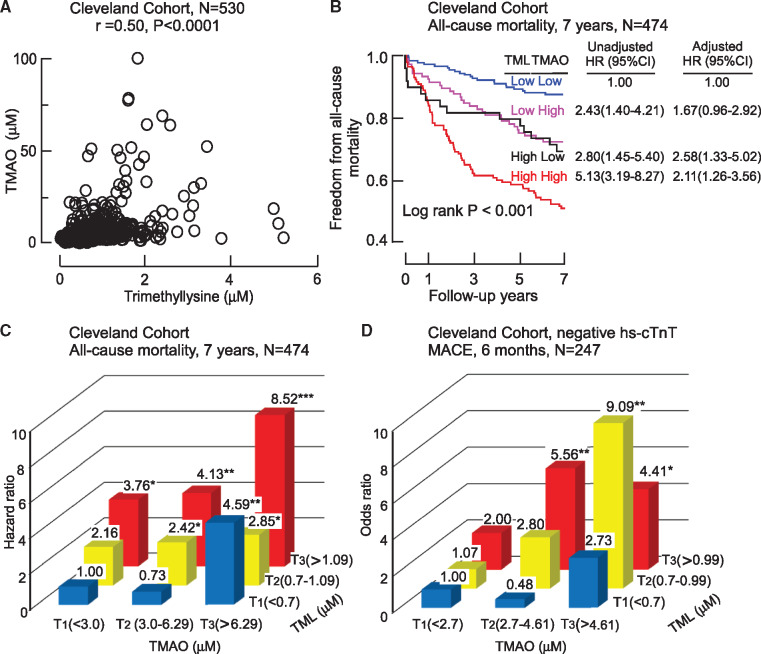
Figure 3.
Plasma trimethyllysine in relation to both incident cardiovascular events and trimethylamine N-oxide in the Cleveland Cohort. (A) Correlation between plasma levels of trimethyllysine and trimethylamine N-oxide in the entire Cleveland Cohort. (B) Kaplan–Meier plot illustrating the relationship between plasma trimethyllysine and risk of incident 7-year risk for mortality according to trimethyllysine and trimethylamine N-oxide levels where each marker is categorized above vs. below the median level in the cohort, median plasma concentration of trimethyllysine (0.89 µM) and trimethylamine N-oxide (4.28 µM) within the cohort was used to stratify patients as ‘high’ (≥median) or ‘low’ (<median) values, also shown are hazard ratio (95% confidence interval) for the indicated trimethyllysine and trimethylamine N-oxide grouping using either an unadjusted model, or following adjustments for traditional cardiovascular risk factors (age, sex, high-density lipoprotein cholesterol, low-density lipoprotein cholesterol, smoking, diabetes mellitus, and hypertension) and indices of renal function (estimated glomerular filtration rate). (C) Plot of unadjusted hazard ratio for incident 7-year mortality risk stratified by tertiles (low, intermediate, and high) of trimethylamine N-oxide (cut-off values 3.0 and 6.29 µM) and trimethyllysine (cut-off values of 0.7 and 1.09 µM). *P < 0.05, **P < 0.01, ***P < 0.001 relative to low/low TMAO/TML group. (D) Plot of unadjusted odds ratio for 6-month major adverse cardiac events stratified by the tertiles which indicated low, intermediate and high levels of trimethylamine N-oxide (cut-off values 2.7 and 4.61 µM) and trimethyllysine (cut-off values of 0.7 and 0.99 µM) among patients who were below the 99th percentile cut-off on hs-cTnT (N = 247). *P < 0.05, **P < 0.01 relative to low/low TMAO/TML group.

