Figure 2.
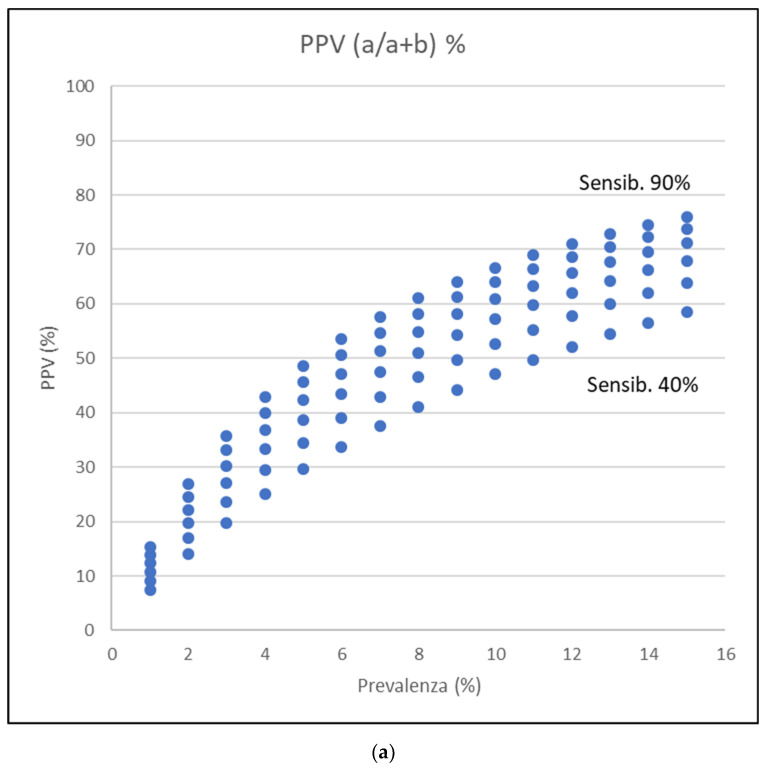
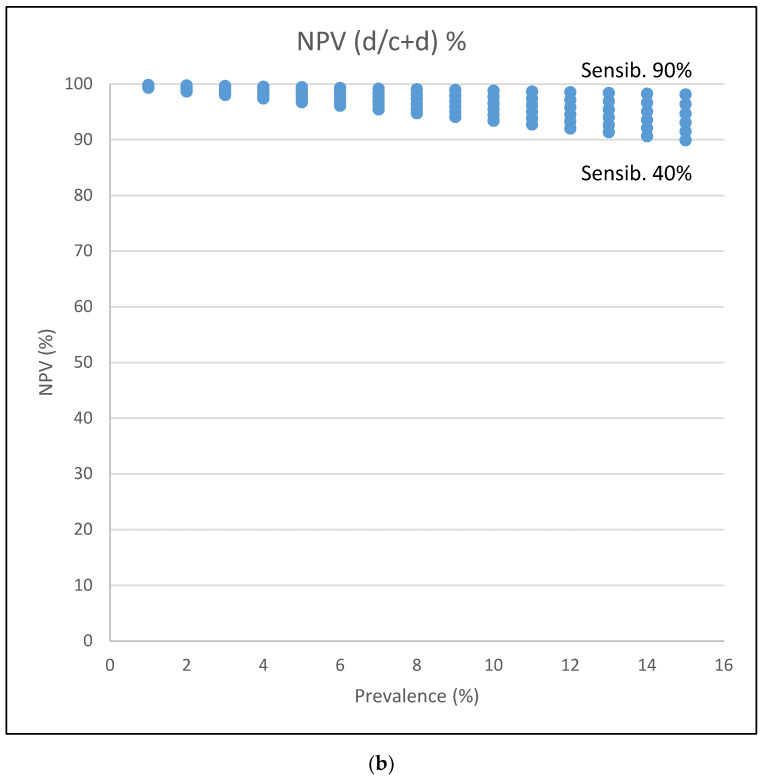
Graphic representation of positive predictive value (PPV) and negative predictive value (NPV) variations with different percentage disease prevalence (X-axis, from 1 to 15%), sensibility variation from 40 to 90%, and fixed specificity at 95%. a: true positive, b: false positive, c: false negative, d: true negative. (a) PPV values show an increase with increasing disease prevalence. (b) NPV values are instead decreasing with disease prevalence increase.


