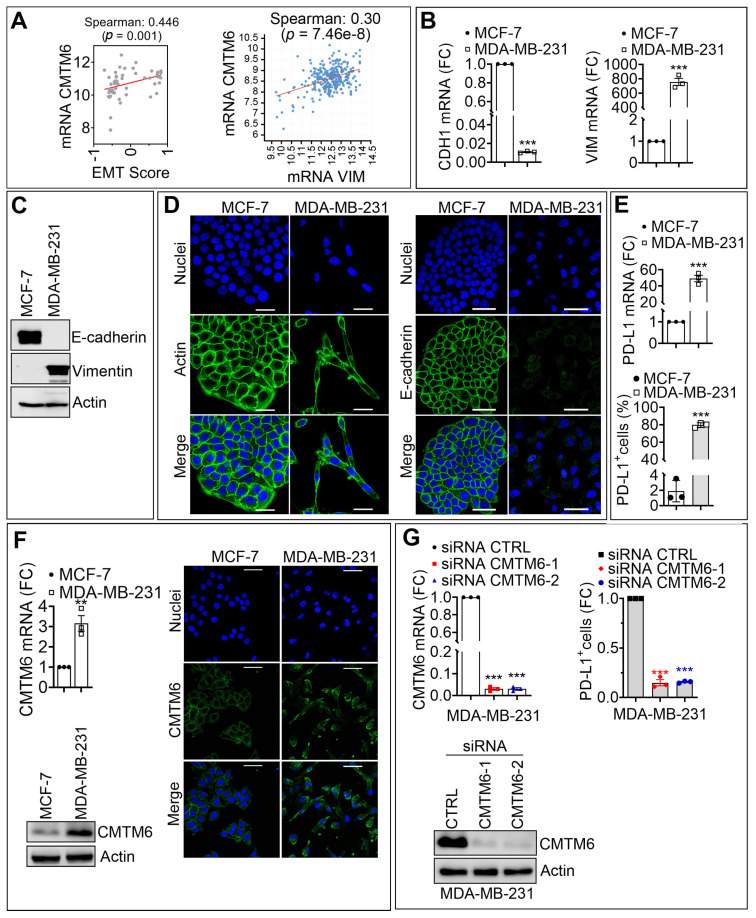
Figure 1.
CMTM6 is upregulated in mesenchymal as compared with epithelial breast cancer cells and regulates PD-L1 cell surface expression. (A) Left panel: Spearman correlation between the EMT score and the mRNA expression of CMTM6 in 51 breast cancer cell lines. Right panel: Spearman correlation between Vimentin (VIM) and CMTM6 mRNA in 299 TNBC patients. The corresponding p-values are reported. (B,C) Comparative expression of mRNA (B) and protein (C) of E-cadherin and Vimentin in MCF-7 and MDA-MB-231 cells. Results in B are reported as fold change (FC) relative to MCF-7 cells. β-Actin was used as a loading control in C. (D) Representative immunofluorescence images of Actin or E-cadherin (green) in MCF-7 and MDA-MB-231 cells. Nuclei are stained with DAPI (blue). Scale bar: 50 µm. (E) mRNA expression (upper panel) and surface expression (lower panel) of PD-L1 in MCF-7 and MDA-MB-231 cells. The results in the upper panel are reported as FC relative to MCF-7 cells, and the results in the lower panel are reported as a percentage (%) of cells expressing PD-L1. (F) Expression of CMTM6 mRNA (upper left panel) and protein (lower left panel) in MCF-7 and MDA-MB-231 cells. Results of the upper left panel are reported as FC relative to MCF-7 cells. β-Actin is used as a loading control in the lower-left panel. Right panels: representative immunofluorescence images of CMTM6 (green) in MCF-7 and MDA-MB-231 cells. Nuclei are stained with DAPI (blue). Scale bar: 50 µm. (G) Expression of CMTM6 mRNA (upper left panel) and protein (lower left panel) in MDA-MB-231 cells transfected with control siRNA (CTRL siRNA) or two different CMTM6 siRNAs (siCMTM6-1 and -2). Results in the upper left panel are reported as FC relative to MCF-7 cells. β-Actin is used as a loading control in the lower left panel. Right panel: Flow cytometry quantification of surface PD-L1 (PD-L1+ cells) as previously. Results are reported as FC relative to CTRL siRNA cells. Results in (B,E,F) (upper left panel), and G (upper panels) represent the average of three independent experiments. Statistically significant differences (indicated by asterisks) are calculated compared with control conditions using an unpaired two-tailed Student’s t-test (** p < 0.01 and *** p < 0.001). For all panels, each dot represents one individual experiment.

