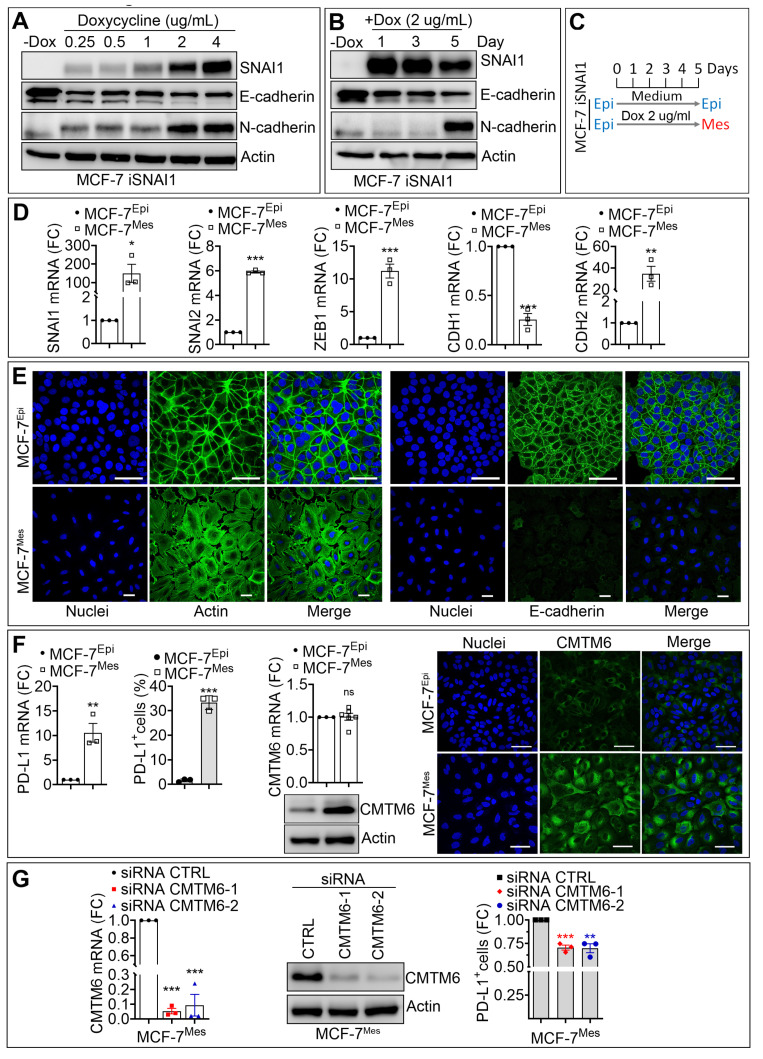
Figure 2.
SNAI1-dependent increase in CMTM6 contributes to PD-L1 cell surface expression in breast cancer cells. (A,B) The expression of SNAI1, E-cadherin (E-CAD), N-cadherin (N-CAD) protein in MCF7 iSNAI1 cells untreated (-DOX) or treated with different doses (0.25, 0.5, 1, 2, 4 µg/mL) of doxycycline for 5 days (A) and at 2 µg/mL at different time points (1, 3, and 5 days) (B) β-Actin was used as a loading control. (C) In vitro doxycycline treatment strategy of MCF-7 iSNAI1 cells. Mes cells were treated with 2 µg/mL of DOX at day 0, 2, and 4 and harvested at day 5 for analysis. At day 5, DOX-treated cells switched to a mesenchymal phenotype (MCF-7Mes) while untreated cells kept their epithelial phenotype (MCF-7Epi). (D) The expression of SNAI1, SNAI2, ZEB1, CDH1, and CDH2 mRNA by RT-qPCR in MCF-7Epi and MCF-7Mes cells. Results are reported as FC relative to MCF-7Epi cells. (E) Representative immunofluorescence images of Actin and E-cadherin (green) in MCF-7Epi and MCF-7Mes cells. Nuclei are stained with DAPI (blue). Scale bar: 50 µm. (F) Expression of PD-L1 mRNA (left panel), PD-L1 cell surface (middle panel), and CMTM6 mRNA and protein (right panels) in MCF-7Epi and MCF-7Mes cells. Scale bar: 50 µm. (G) Expression of CMTM6 mRNA (left) and CMTM6 protein (middle) in MCF-7Mes cells transfected with CTRL siRNA or two different CMTM6-targeting siRNAs (siCMTM6-1 and -2). Right panel: Flow cytometry quantification of PD-L1+ cells transfected with two different CMTM6-targeting siRNAs (siCMTM6-1 and -2). Results in left and right panels are reported as FC relative to control cells. For all panels, each dot represents one independent experiment and results represent the average all independent experiments. Statistically significant differences (indicated by asterisks) are calculated compared with control conditions using an unpaired two-tailed Student’s t-test (* p < 0.05; ** p < 0.01 and *** p < 0.001).

