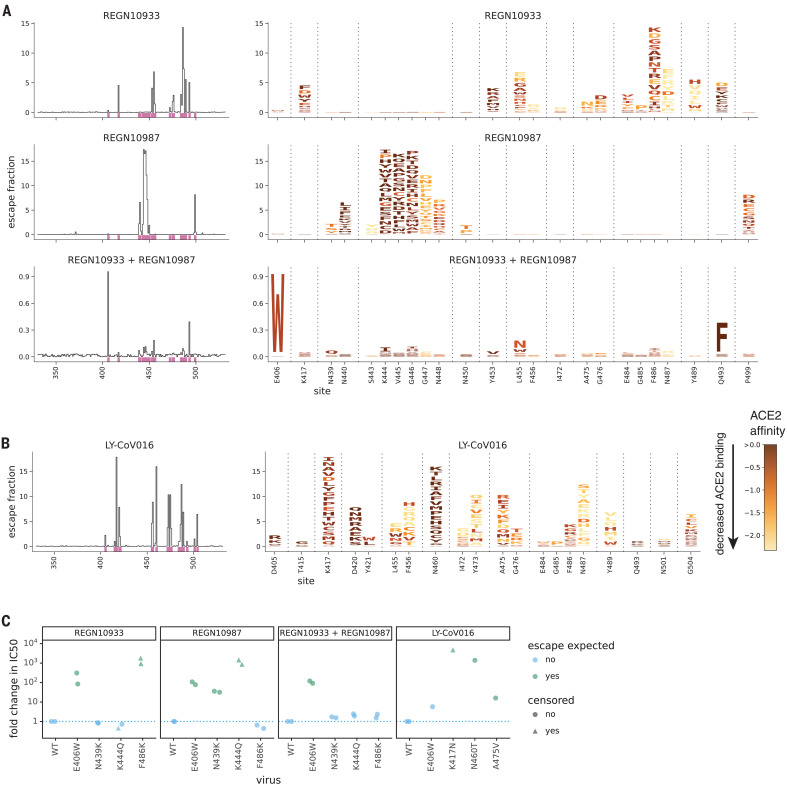
Fig. 1. Complete maps of mutations that escape binding by the REGN-COV2 antibodies and Ly-CoV016.
(A) Maps for antibodies in REGN-COV2. Line plots at left show escape at each site in the RBD (summed effects of all mutations at each site). Sites of strong escape (purple underlines) are shown in logo plots at right. The height of each letter is proportional to how strongly that amino acid mutation mediates escape, with a per-mutation “escape fraction” of 1 corresponding to complete escape. The y-axis scale is different for each row, so, for instance, E406W escapes all REGN antibodies but is most visible for the cocktail as it is swamped out by other sites of escape for the individual antibodies. See https://jbloomlab.github.io/SARS-CoV-2-RBD_MAP_clinical_Abs/ for zoomable versions. Letters are colored according to how mutations affect the RBD’s affinity for ACE2 as measured via yeast display (7), with yellow indicating poor affinity and brown indicating good affinity; see fig. S2, A and B, for maps colored by how mutations affect expression of folded RBD and fig. S2, C and D, for distribution of effects on ACE2 affinity and RBD expression across all mutations observed among circulating viral isolates. (B) Map, as in (A), for LY-CoV016. (C) Validation of key mutations in neutralization assays using spike-pseudotyped lentiviral particles. We chose to validate mutations predicted to have large effects or that are present at high frequency among circulating SARS-CoV-2 isolates (e.g., N439K). Each point indicates the fold increase in the median inhibitory concentration (IC50) for a mutation relative to the unmutated wild-type (WT) spike, which contains D614G. The dotted blue line at 1 indicates WT-like neutralization, and values >1 indicate increased neutralization resistance. Point colors indicate whether escape was expected at that site from the maps. Point shapes indicate that the fold change is censored (an upper or lower limit) owing to the IC50 being outside the dilution series used. Most mutants were tested in duplicate and thus have two points. Full neutralization curves are shown in fig. S3. Single-letter abbreviations for the amino acid residues are as follows: A, Ala; C, Cys; D, Asp; E, Glu; F, Phe; G, Gly; H, His; I, Ile; K, Lys; L, Leu; M, Met; N, Asn; P, Pro; Q, Gln; R, Arg; S, Ser; T, Thr; V, Val; W, Trp; and Y, Tyr.

