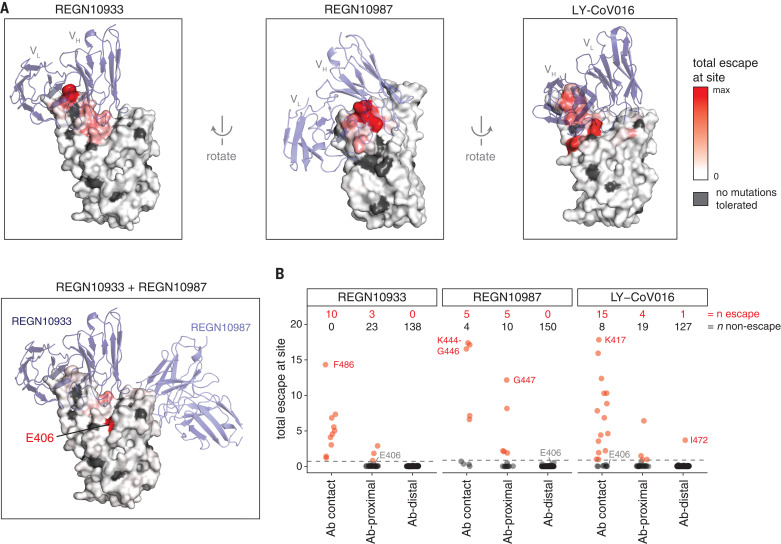
Fig. 4. Structural context of escape mutations.
(A) Escape maps projected on antibody-bound RBD structures. [REGN10933 and REGN10987: Protein Data Bank (PDB) ID 6XDG (11); LY-CoV016: PDB ID 7C01 (13)]. Antibody heavy- and light-chain variable domains are shown as blue cartoons, and the RBD surface is colored to indicate how strongly mutations at that site mediate escape (white indicates no escape, red indicates strongest escape site for that antibody or cocktail). Sites where no mutations are functionally tolerated are colored gray. (B) For each antibody, sites were classified as direct antibody contacts (non-hydrogen atoms within 4 Å of antibody), antibody-proximal (4 to 8 Å), or antibody-distal (>8 Å). Each point indicates a site, classified as escape (red) or non-escape (black). The dashed gray line indicates the cutoff used to classify sites as escape or non-escape (see materials and methods for details). Red and black numbers indicate how many sites in each category are escape or non-escape sites, respectively. Interactive visualizations are at https://jbloomlab.github.io/SARS-CoV-2-RBD_MAP_clinical_Abs/, and hypothesized mechanisms of escape and additional structural details for labeled points are shown in fig. S6.

