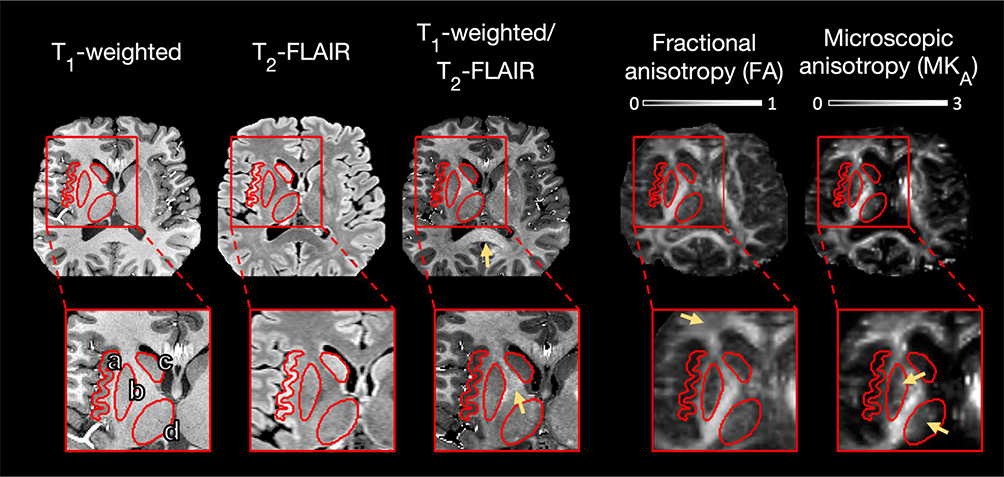
FIGURE 2.
Imaging results from the normal brain. Magnified regions highlight different gray matter structures: the cerebral cortex (a), the putamen (b), the head of the caudate nucleus (c), and the thalamus (d). The T1-weighted image was darker in gray matter than in white matter, with lowest intensities in the cerebral cortex and in the head of the caudate nucleus followed by the putamen. The T2-fluid-attenuated inversion recovery (FLAIR) image featured a similar but opposite pattern. The image obtained as the ratio between the T1-weighted and the T2-FLAIR images featured a sharp contrast that emphasized myelin-rich regions such as the corpus callosum and the internal capsule (arrows). Both the fractional anisotropy (FA) map and the microscopic diffusion anisotropy (MKA) map were dark in gray matter and bright in white matter. However, the FA was comparatively low in the anterior corona radiata (arrow), and the MKA revealed higher levels of microscopic anisotropy in the lateral thalamus and in the medial putamen (arrows). All contrasts were coregistered to the T1-weighted image space. The T1-weighted and T2-FLAIR intensities are in arbitrary units, and the FA and MKA are dimensionless

